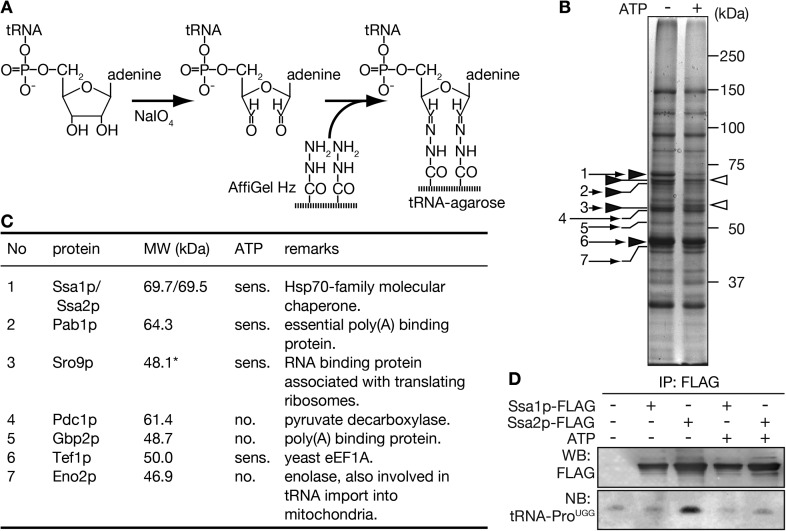
Figure 1. Purification of tRNA-interacting proteins with immobilized tRNA-resin.
(A) A schematic diagram for preparation of tRNA-agarose by hydrazide coupling. (B) tRNA-binding proteins purified with the tRNA-agarose were analyzed by SDS-PAGE/CBB staining. Purification was performed in the absence (−) or presence (+) of 3 mM Mg-ATP. Bands appearing mainly in the ATP minus or plus lanes are marked by closed and open arrowheads, respectively. Bands that were identified by peptide mass fingerprinting after in-gel digestion are indicated by small numbered arrows. (C) A summary of the proteins identified in B. The numbers correspond to the arrows shown in B. *Sro9p, with a calculated molecular mass of 48.1 kDa, is known to migrate as a 60-kDa band on SDS-PAGE (Sobel and Wolin, 1999). (D) Yeast lysates prepared from strains expressing either Ssa1p-FLAG or Ssa2p-FLAG in addition to the wild type-strain were subjected to immunoprecipitation with anti-FLAG agarose in the absence (−) or presence (+) of 3 mM Mg-ATP. One-tenth of the eluates were analyzed by Western blotting with the anti-FLAG antibody (WB), and the remainders of the eluates were subjected to RNA extraction and Northern blotting with a probe against mature tRNA-ProUGG (NB).


