. 2015 Apr 8;4:e04659. doi: 10.7554/eLife.04659

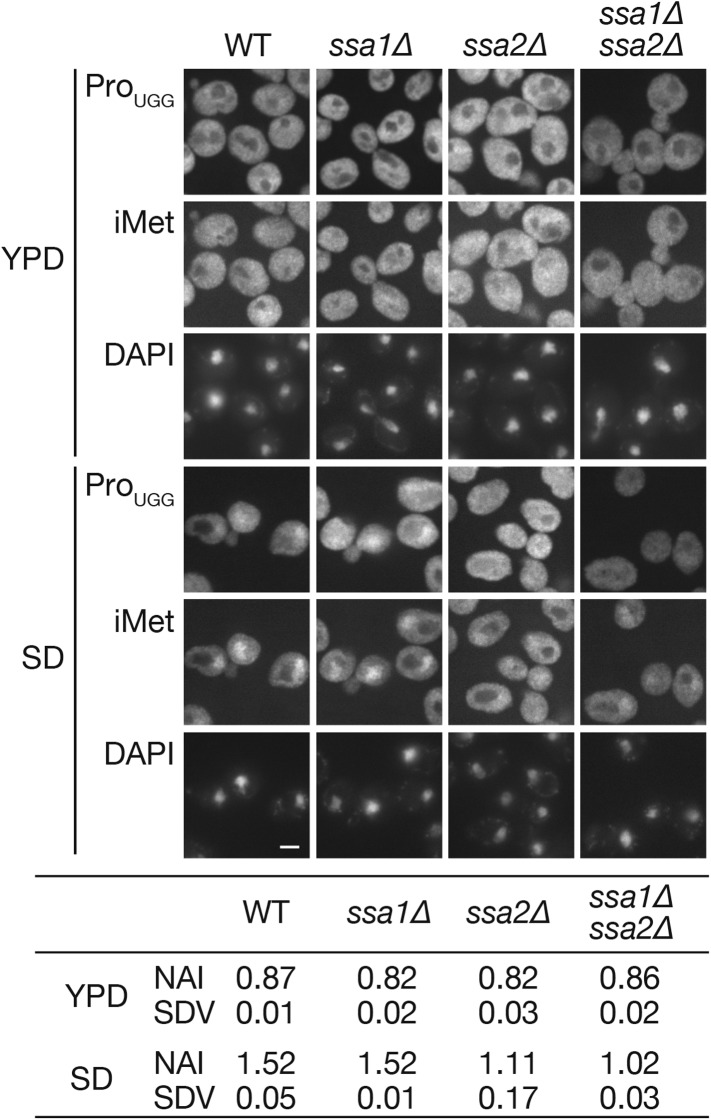
Figure 3. The ssa1∆ ssa2∆ double deletion does not cause a synergistic effect on the nuclear accumulation of tRNAs under starvation conditions.

Figure 3.

Wild-type (W303-1A), ssa1∆ (TYSC918), ssa2∆ (TYSC920), and ssa1∆ ssa2∆ double mutant (TYSC1013) strains were cultured in YPD (YPD) and transferred to SD+Ade, Ura (SD) for 2 hr. The cells were subsequently subjected to FISH analysis with anti-tRNA-ProUGG and tRNA-iMet probes. Bar, 5 µm. The fluorescence signals of tRNA-ProUGG images of three independent experiments were quantified, and the average NAIs with SDVs were calculated. Original microscopic images and individual data for quantitative FISH in this figure will be found in Figure 3—source data 1.

DOI: http://dx.doi.org/10.7554/eLife.04659.010

Figure 3—source data 1. Zip file containing source data for Figure 3.
Yeast cells are processed as described in the Figure 3 legend and the ‘Materials and methods’ section. Images from three independent sets of FISH experiments are subjected to quantification. Each folder named as Fig3_expX contains gray-scale tif images with 16 bit depth (acquired by MetaMorph) of a set of the experiments. A file name consists of the strain name (‘wt,’ ‘ssa1,’ for example) and culture conditions (‘YPD’ or ‘SD’) with the last capital letter representing the recording channel (‘D’ for DAPI staining or ‘R’ for RNA FISH). If the number of cells suitable for quantification in one image was under 30, those from two images were quantified. In such cases, two sets of images (‘ssa2_SD_a_R.tif’ and ‘ssa2_SD_b_R.tif’ for example) are included. Raw quantification data and their processing to NAIs are summarized Excel files. Summary of the total experiments are shown in the ‘SUMMARY’ sheet in the file named ‘Figure 3_data_summaryandexp1_DATA.xls.’ All the tif images have 16-bit depth.
elife04659s002.zip (64.1MB, zip)
DOI: 10.7554/eLife.04659.011