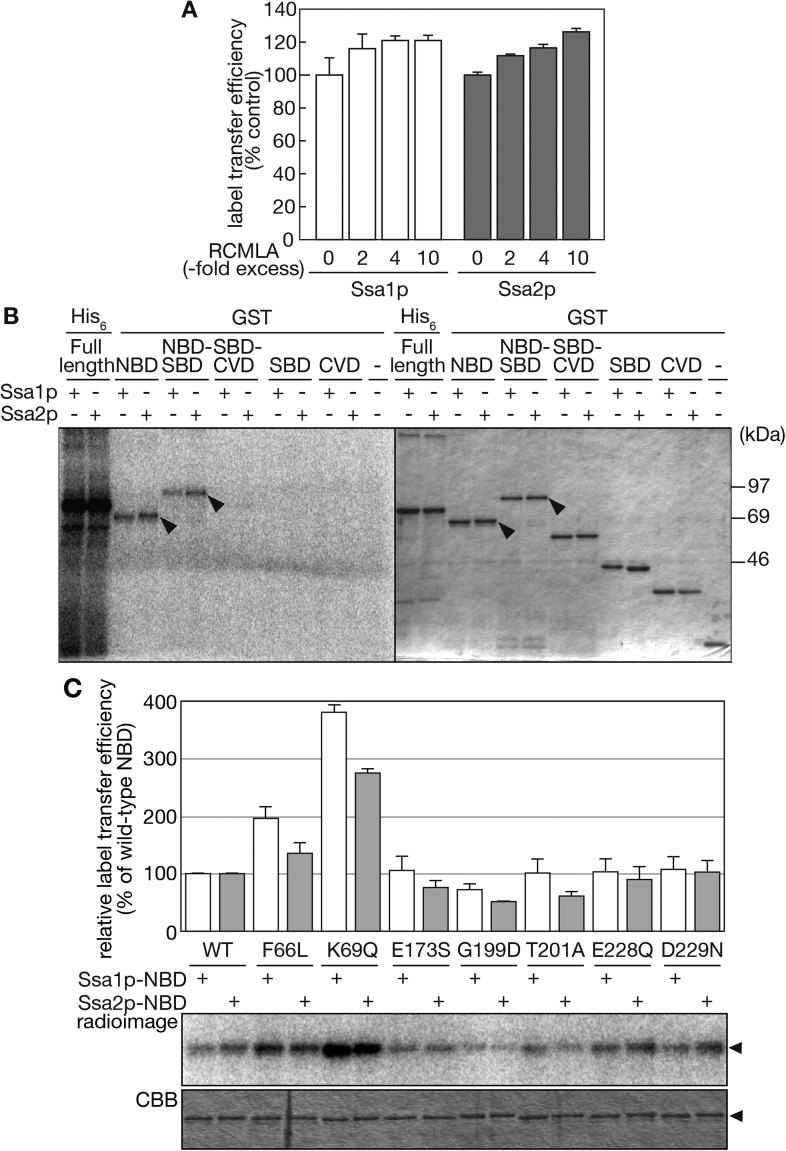
Figure 6. The NBD of Ssa proteins is essential for tRNA recognition.
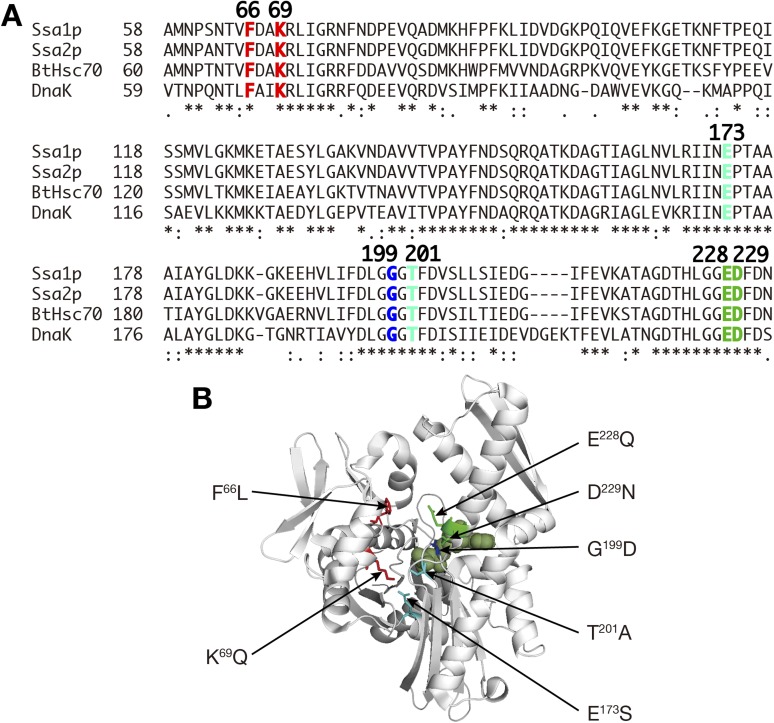
(A) Label transfer assays with 32P-labeled tRNA-ProUGG were performed in the presence of various concentrations of RCMLA. The amount of RCMLA is shown as the molar ratio against Ssa proteins. (B) Label transfer assays with full-length Ssa-His6 fusions or GST-fusions with partial Ssa proteins. Left, radioimaging; right, CBB staining. Arrowheads indicate the bands of GST-fusions that received radioactivity. (C) Label transfer assays were carried out with wild-type or mutant forms of GST-Ssa1p-NBD (Ssa1p-NBD) or GST-Ssa2p-NBD proteins (Ssa2p-NBD). Quantitated data and raw gel images of a typical experiment are shown in the upper graph and the lower panels, respectively. The relative label transfer efficiency represents a ratio of label transfer of a mutant GST-Ssa-NBD to that of the corresponding wild type. The efficiency of the wild-type protein is set to 100%. All the experiments are done in triplicates, and error bars represent SDVs. Original gel images and individual quantification data for the label transfer assays in this figure will be found in Figure 6—source data 1.
DOI: http://dx.doi.org/10.7554/eLife.04659.017


