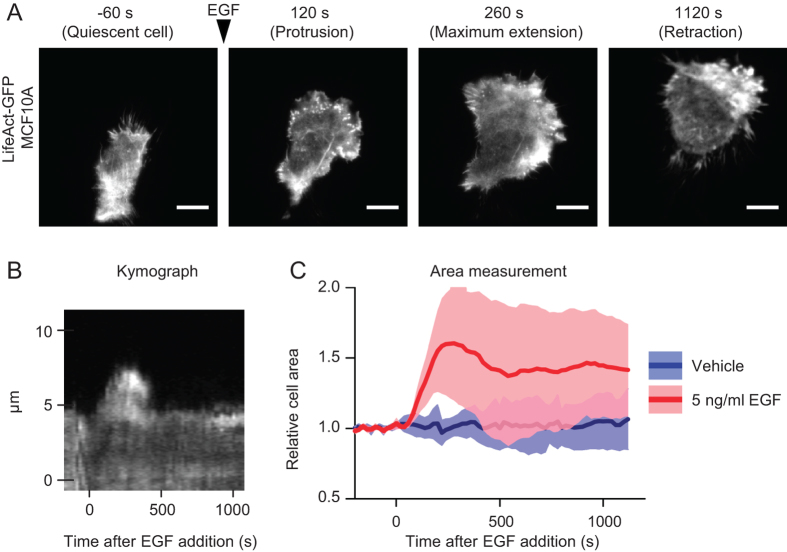
Figure 1. EGF stimulation induces protrusion formation and retraction.
(A) MCF10A cells were infected with pLKO.1 LifeAct-GFP, deprived of EGF for 6 hours and kept in a humidified chamber at 37 °C and 5% CO2. Cells were then imaged by means of TIRF microscopy. The depth of the evanescent field was kept at 90 nm. Cells were imaged over a time period of 1180 seconds and either stimulated or not with 5 ng/ml EGF. The time at which the stimulus was added was set to t = 0 seconds. Images were acquired every 20 seconds (Video S1). Four time-points are reported in the figure: −60 seconds (before EGF addition, quiescent cell), 120 seconds (protrusion), 260 seconds (maximum extension) and 1120 seconds (retraction). Scale bars, 10 μm. (B) Kymograph of a pLKO.1 LifeAct-GFP MCF10A cell stimulated as in A. A segment perpendicular to lamellipodium was used to monitor fluorescence intensity at each time points, and then the different time points were assembled. (C) Cell surface area variation observed by TIRF microscopy of pLKO.1 LifeAct-GFP MCF10A cells stimulated with EGF or unstimulated in which only the medium containing EGF was added (vehicle). Dark thick lines represent the mean values while light shades represent the area included between + SD and – SD.

