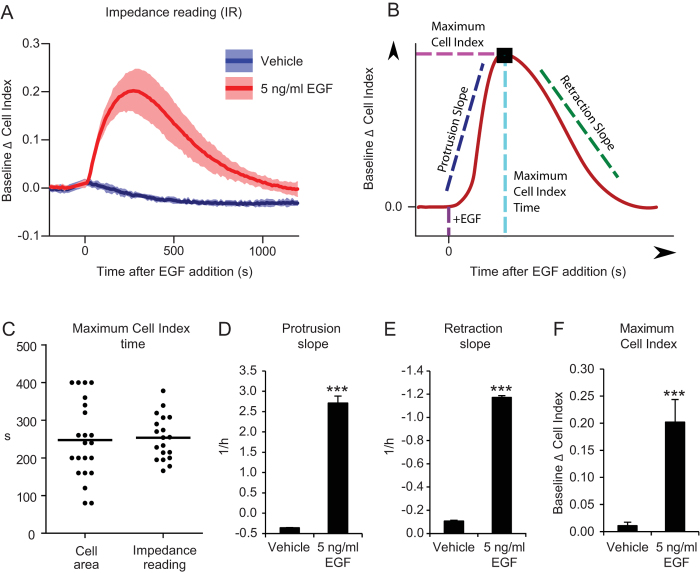
Figure 2. Real-time evaluation of cell protrusion dynamics by IR.
(A) Baseline Δ cell index values obtained by IR of MCF10A cells stimulated or not with EGF at t = 0. (B) Cartoon showing the indicators that we use for quantification of the IR response to EGF stimulation. The point where the EGF response curve reaches the highest value corresponds to Maximum Cell Index and the Maximum Cell Index Time (tm). The protrusion slope is calculated as the mean slope between t0 and tm, where t0 is the first time point after growth factor addition. The retraction slope is calculated as the mean slope between tm and t2m, where t2m is twice tm. (C) Maximum Cell Index Time (tm) of a number of experiments performed by means of TIRF microscopy or IR of MCF10A stimulates with 10 ng/ml of EGF. Each point represents a separate experiment. Dashes represent the mean values. (D) Protrusion slope, (E) retraction slope and (F) maximum value of Baseline Δ cell index curve of MCF10A stimulated or not with 5 ng/ml EGF. ***P < 0.001.

