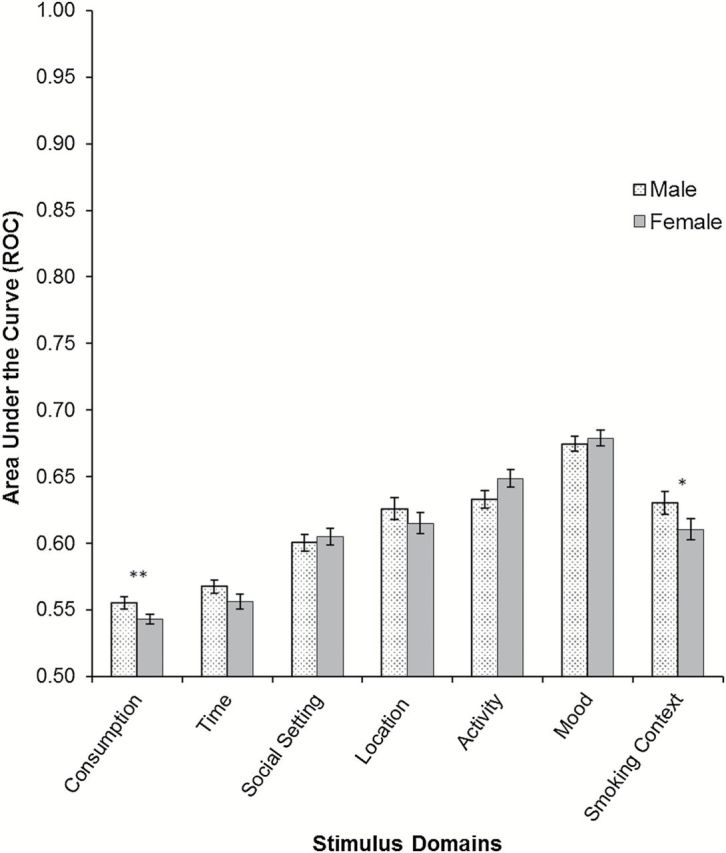
Figure 1.

Average AUC-ROC by gender for domains of context. The ROC value indicates the probability of correct prediction that an observation is a smoking versus a nonsmoking situation. Thus a value of 0.50 indicates no association of smoking with the domain, while a value of 1.0 would represent perfect prediction. Gender differences were tested between subjects by t tests. (**p < .05, *p < .10). The mood model includes negative affect, positive affect, arousal, and inattention factor scores as predictors, including both linear and quadratic components.
