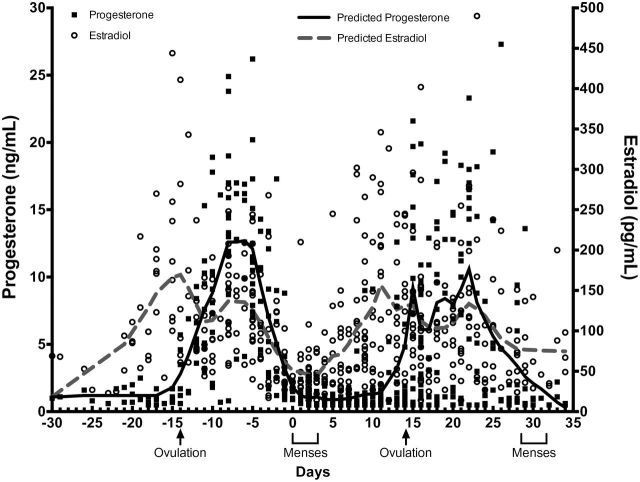
Figure 2.
Participant estradiol (open circles) and progesterone (solid squares) levels during the course of study procedures; participant data is anchored to self-report onset of menses (center of x-axis denoted as day 0). The solid and dashed lines are LOESS regression curves that characterize the change in progesterone and estradiol levels, respectively, across participant menstrual cycles.

