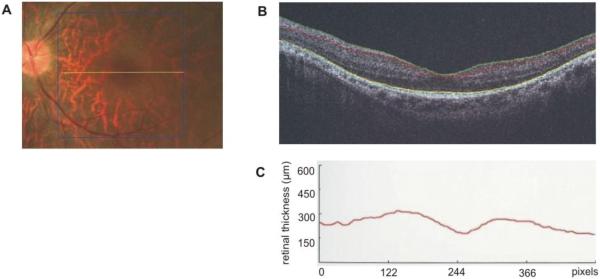
Figure 3.
OCT of the fovea and perifoveal area of the left eye of patient V:7. (A) The location were the cross-section was made (B) OCT image, showing increased inner retinal thickness. The pit in the middle of the picture is the fovea. (C) A graph showing the thickness of the inner retinal layer. A maximal thickness of 248 μm was seen, while normal values range between 150 and 200 μm.

