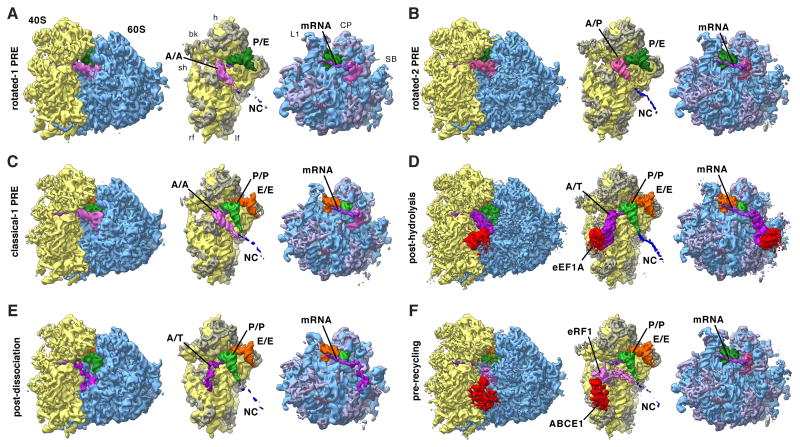
Figure 2. Functional States Reconstructed from Human Polysomes.
Cryo-EM maps filtered to their global resolution (Table S1) corresponding to (A) rotated-1 PRE, (B) rotated-2 PRE, (C) classical-1 PRE, (D) post-hydrolysis (E) post-dissociation and (F) pre-recycling states. For the POST state at high resolution see Figure 4. For the rotated PRE* state and states featuring intermediate amounts of rolling see Figure S2. Left: Ribosomal complexes with SSU depicted in yellow and LSU in blue. Right: Segmented cryo-EM maps, rotated by 80°: A/A-site tRNA (pink), A/T-site tRNA (dark pink), A/P-site tRNA (medium pink), eRF1 (pink), P-site tRNA (green), P/E-site tRNA (dark green), E-site tRNA (orange), mRNA (purple), eEF1 A (red), ABCE1 (red), NC (blue), 18S RNA (yellow), 40S r-proteins (gray-yellow), 28S, 5S, 5.8S RNA (blue), and 60S r-proteins (gray-blue). See also Figure S2 and Table S1.

