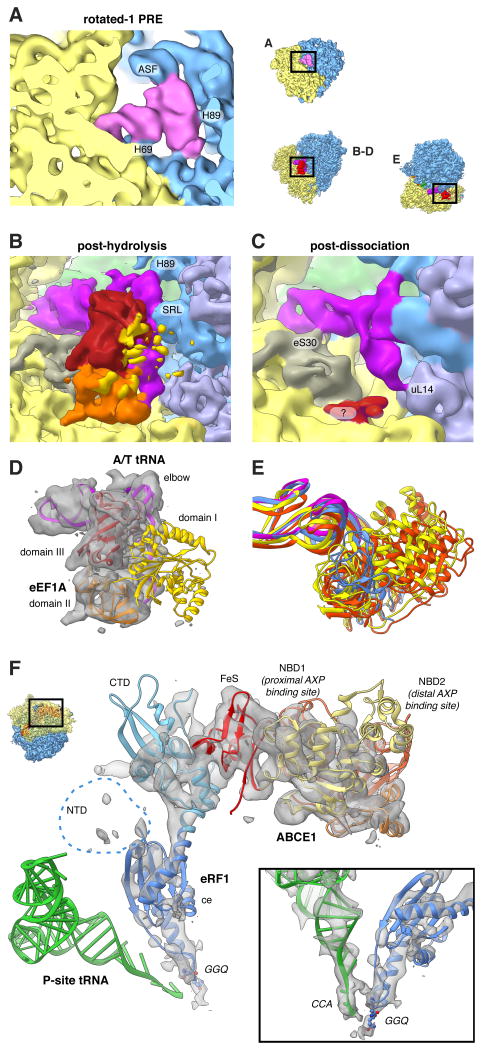
Figure 3. Imaging Ex vivo-derived Polysomes Allows the Visualisation of Transient States.
(A) Close-up view of the rotated-1 PRE state A-site tRNA and (B-E) of the post-decoding states. (B,D) Only domain III (red) and domain II (orange) of eEF1A feature strong density, while domain I (yellow) is fragmented. The A/T-tRNA (dark pink) elbow is connected to the SRL and H89. (C) For the post-dissociation state additional contacts with eS30 and uL14 are visible. A fragmented density of unclear origin is shown in red. (E) 18S RNA-based overlay of decoding-sampling (yellow), decoding-recognition (orange), post-decoding post-hydrolysis (blue) and post-decoding post-dissociation (pink) models for eEFIA and the A/T-tRNA elbow. (F) Close-up view of the pre-recycling state showing eRF1 (shades of blue) and ABCE1 (yellow to red). Atomic models are based on (Preis et al., 2014). See also Movie S1.

