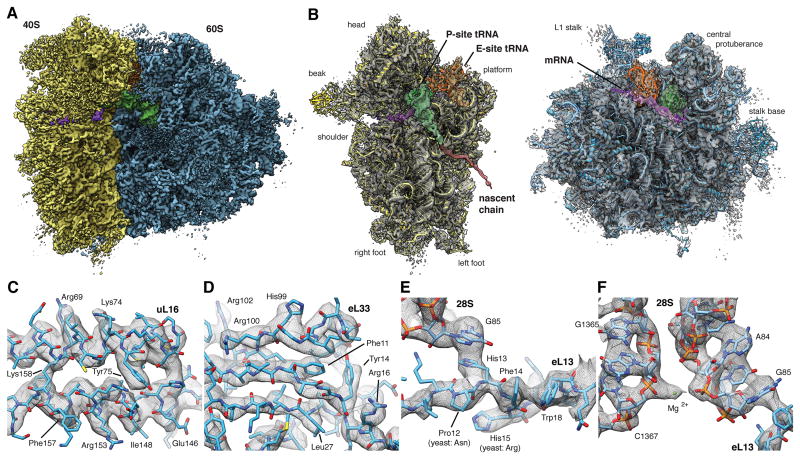
Figure 4. High-resolution Structure of the Human Ribosome in the POST State.
(A) Surface representation of the POST state cryo-EM map filtered to 3.5 A (blue: LSU, yellow: SSU, green: P-site tRNA, orange: E-site tRNA, purple: mRNA). (B) Individual subunit maps with the corresponding atomic models. Segmented density corresponding to the NC (red) is shown filtered to 7.0 A for clarity. Segmented maps are shown turned by 80°. (C-F) Enlarged regions of the cryo-EM map showing well-resolved (C) alpha-helices or (D) beta-strands with individual side-chains, (E,F) strong π -stacking interactions and (F) individual nucleotides with nearby ions. See also Figures S3 and S4. See also Tables S2, S3 and S4.

