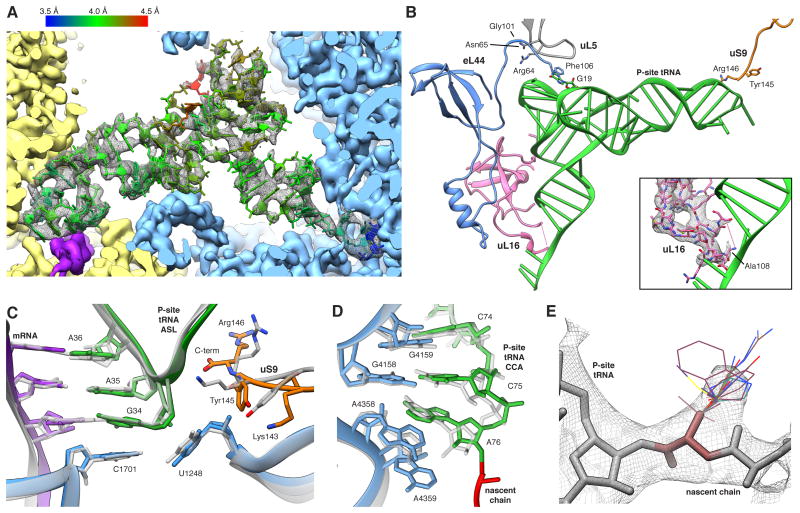
Figure 6. The P-site tRNA is Defined Despite Chemical Heterogeneity.
(A) Cryo-EM map (mesh) and atomic model of the P-site tRNA (colored by local resolution as determined by ResMap). SSU yellow, LSU blue and mRNA density in purple. (B) Key interactions of the P-site tRNA with its binding pocket on LSU and SSU. The insert shows the fragmented density of the uL16 P-site loop (mesh). (C,D) Comparison between prokaryotic (transparent) and human (color) (C) ASL and (D) PTC. Atomic models of the prokaryotic (PDB ID 2J00) and the eukaryotic LSU were aligned based on the LSU rRNA. (E) Cryo-EM map (mesh) of A76 and the first residues of the NC. Stick representations depict the most abundant rotamers of each amino acid with the exception of phenylalanine and tyrosine, where less abundant rotamers are depicted, and proline, which is not shown. See also Figures S5 and S6.

