
Figure 2.
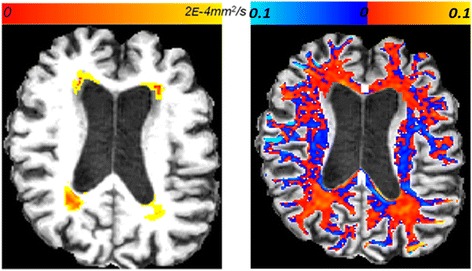
Illustration of DW-MRI changes location. Left: Regional changes in mean diffusivity within T1-hypointensities, before versus after the acetazolamide treatment for patient ACZ_3. Right: Changes in isotropic water fraction, within white matter, on the same brain slice. Red indicates decrease in the isotropic water fraction, blue indicates increase.