
Figure 1.
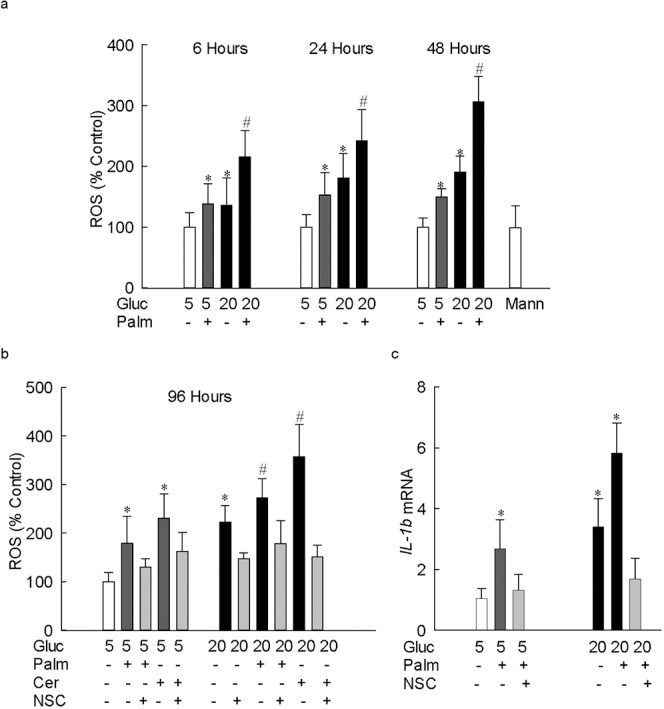
Lipotoxicity augments glucotoxicity-induced increases in ROS and IL-1β levels in retinal endothelial cells. Total ROS levels were quantified in 5 μg protein using DCHFDA, and the resultant fluorescence was measured at 485 nm and 530 nm as excitation and emission wavelengths, respectively, in retinal endothelial cells incubated in 5 mM or 20 mM glucose media (a) for 6 to 48 hours in the presence or absence of 50 μM palmitate, and (b) for 96 hours in the presence palmitate or ceramide (50 μM). (c) The gene transcripts of IL-1β were quantified by real-time PCR in the cells incubated in 5 mM or 20 mM glucose media for 96 hours, with or without 50 μM palmitate; β-actin was used as a housekeeping gene. The results are represented as mean ± SD from three to four cell preparations, with each measurement made in duplicate. *P < 0.05 vs. 5 mM glucose and #P < 0.05 vs. 20 mM glucose; 5 and 20 = 5 mM or 20 mM glucose; Gluc, glucose; Palm, palmitate; Cer, ceramide; NSC, 20 μM NSC23766; Mann, 20 mM mannitol.