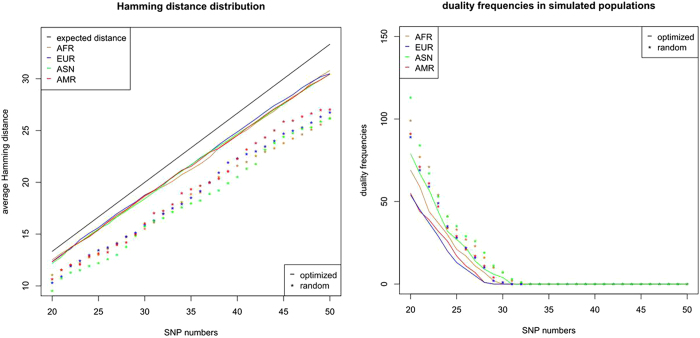
Figure 4.
In the simulated populations (AFR, ASN, AMR, EUR), each of which has 100 thousand individuals, the Hamming distances and duality frequencies are generated by both the optimized sets of SNPs and the random sets of SNPs. The SNP numbers range from 20 to 50. The different populations are represented by different colors, and the lines stand for the optimized sets of SNPs and the asterisks stand for the average values of the random sets of SNPs.

