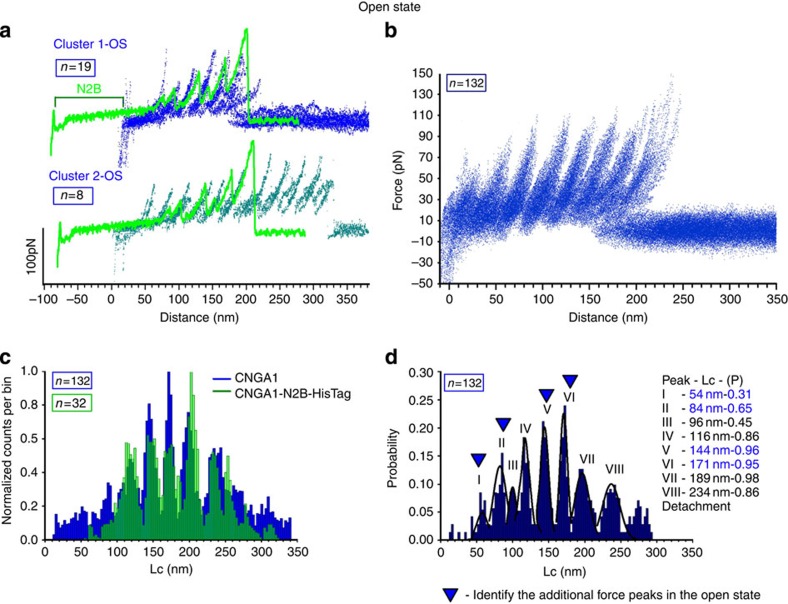
Figure 2. Unfolding of CNGA1 and CNGA1-N2B-HisTag in the open state.
(a) Example of F–D curves obtained from the unfolding of single CNGA1 (blue and cyan) and CNGA1-N2B-HisTag (green) constructs in the open state (19 curves for cluster 1-OS, 8 curves for cluster 2-OS and 1 curve for CNGA1-N2B-HisTag). The construct with N2B has an initial flat region of 85 nm, followed by peaks that correspond to the unfolding events that were observed in the CNGA1 construct. (b) Superimposition of 132 F–D curves that were obtained from injected oocytes in the open state using the curves of Cluster 1-OS as a template. (c) Superimposition of the histograms of normalized counts/bin against Lc from the F–D curves of b (blue) and 32 F–D curves from the CNGA1-N2B-HisTag (green) constructs in the open state. (d) Histogram of Lc values of force peak (with Gaussian fit for the different peaks) from the F–D curves in d with eight peaks located at 54±3 (mean±s.d., n=41), 84±3 (mean±s.d., n=86), 96±3 (mean±s.d., n=59), 116±3 (mean±s.d., n=114), 144±3 (mean±s.d., n=132), 171±3 (mean±s.d., n=132), 189±5 (mean±s.d., n=132), 234±6 (mean±s.d., n=132) nm and the detachment; the probabilities of the unfolding are 0.31, 0.65, 0.45, 0.86, 0.96, 0.95, 0.98 and 0.86, respectively.

