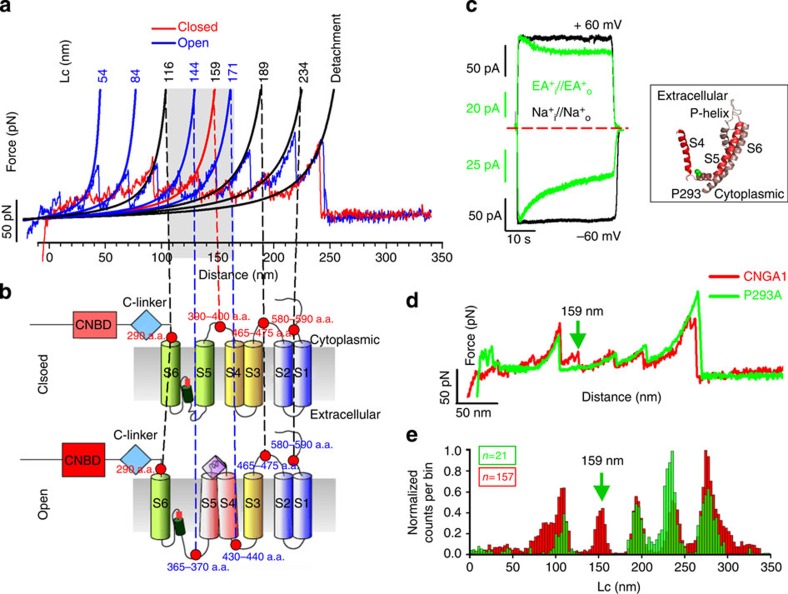
Figure 5. Conformational changes in the transmembrane domain during the gating of CNGA1 channels.
(a) Superposition of two representative F–D curves of CNGA1 channels in the closed (red) and open (blue) states. Continuous black lines obtained from the fitting with WLC model. Numbers indicate the corresponding values of Lc. (b) Schematic representation of hypothesized interactions between the transmembrane helices in the closed and open states. Red dots indicate the approximate location of the force peaks and the numbers of the corresponding a.a. (c) Electrophysiological recordings from mutant channel P293A in the presence of Na+ (black) and ethylammonium (EA+) (green) at ±60 mV. In the black box, the homology model of the S4 and S6 transmembrane domains of the CNGA1 channel based on the molecular structure of the Kv1.2 channel; the conserved P293 is indicated in green. (d) Superposition of two representative F–D curves for the CNGA1 channel (red) and for the P293A (green), both in the closed state. The green arrow, corresponding to the value of Lc=159 nm, indicates the differences between the two constructs. (e) Superimposition of histograms of normalized counts/bin against Lc from the 157 F–D curves of CNGA1 (red, the same as in Fig. 1h) and 21 F–D curves from mutant channel P293A in the closed state (green), both in the closed state. Arrow as in d.

