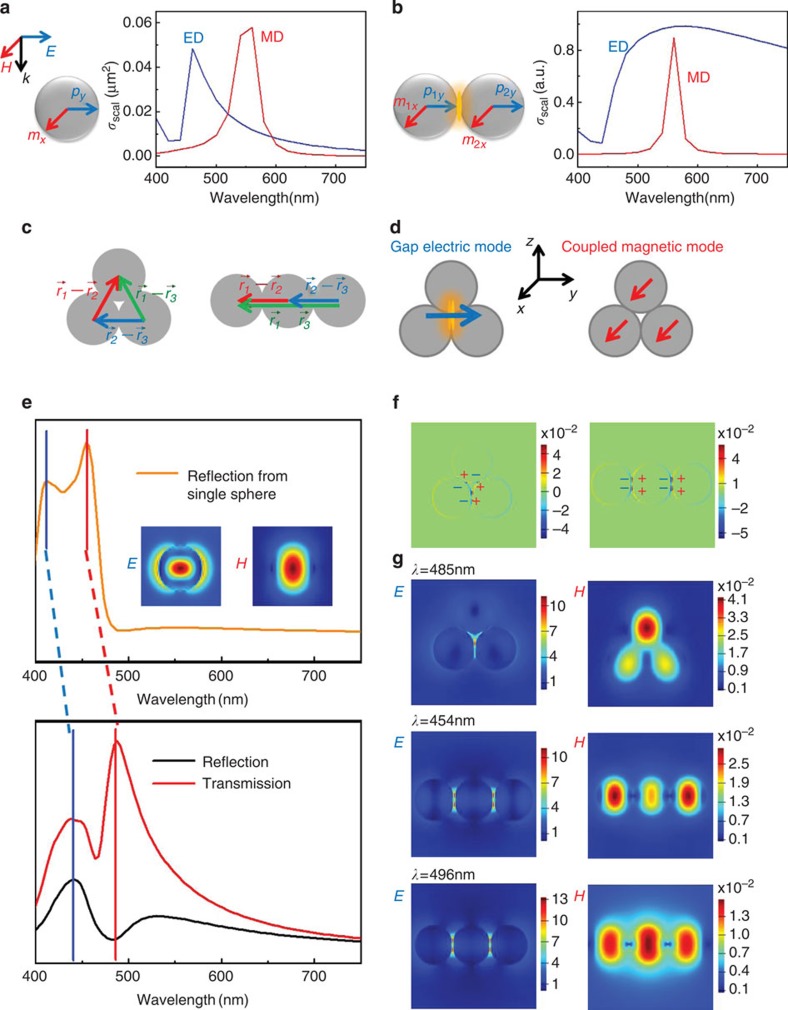
Figure 2. Mechanism of MIT.
(a) The scattering cross-sections contributed by magnetic dipole (MD) and electric dipole (ED) in an individual silicon sphere with diameter of 130 nm. (b) The scattering cross-sections contributed by magnetic dipole and electric dipole in a silicon nanosphere homodimer with diameters of 130 nm. (c) The schematic shows the difference between two kinds of trimer when calculating the interaction between each of two spheres. (d) The schematic describes two new modes: the gap electric mode and the coupled magnetic mode. (e) The hybridization process in a typical D3h trimer with diameter of 100 nm. The blue bar reveals the variation from electric dipole mode in the individual sphere to the gap electric mode. The red bar reveals the variation from magnetic dipole mode to the coupled magnetic mode. The insets in the individual sphere's spectrum are field distributions at resonance wavelengths. Moreover, the difference between transmission and reflection spectra indicates the directivity caused by the electro-magnetic interaction. (f) The charge density distributions of D3h and D∞h trimers. (g) The electric field distribution of the gap mode and the magnetic field distribution of the D3h trimer at 485 nm where the antireflection dip happens. The broad electric gap mode and the maximum magnetic responses of the D∞h trimer at 454 and 496 nm.

