Figure 3.

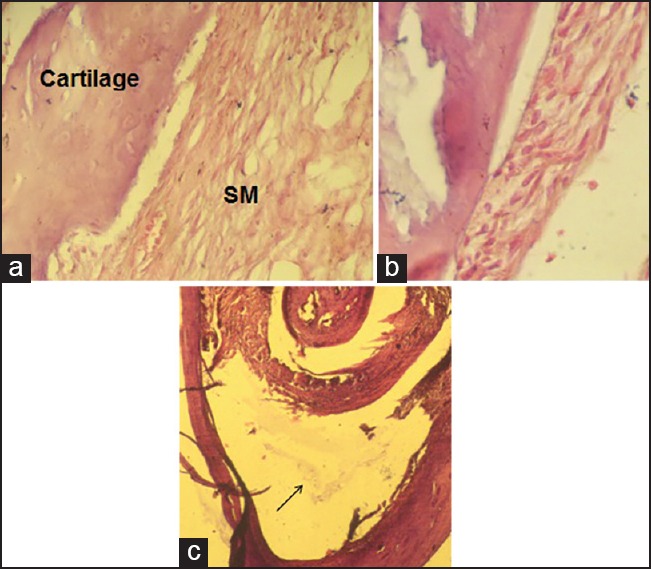
Steroid group, early phase, showing (a) normal synovial memberane (SM) and cartilage (×400); (b) increased synovial cell adhesion (×400); (c) floating fibrin in joint space (arrow) (×100).

Steroid group, early phase, showing (a) normal synovial memberane (SM) and cartilage (×400); (b) increased synovial cell adhesion (×400); (c) floating fibrin in joint space (arrow) (×100).