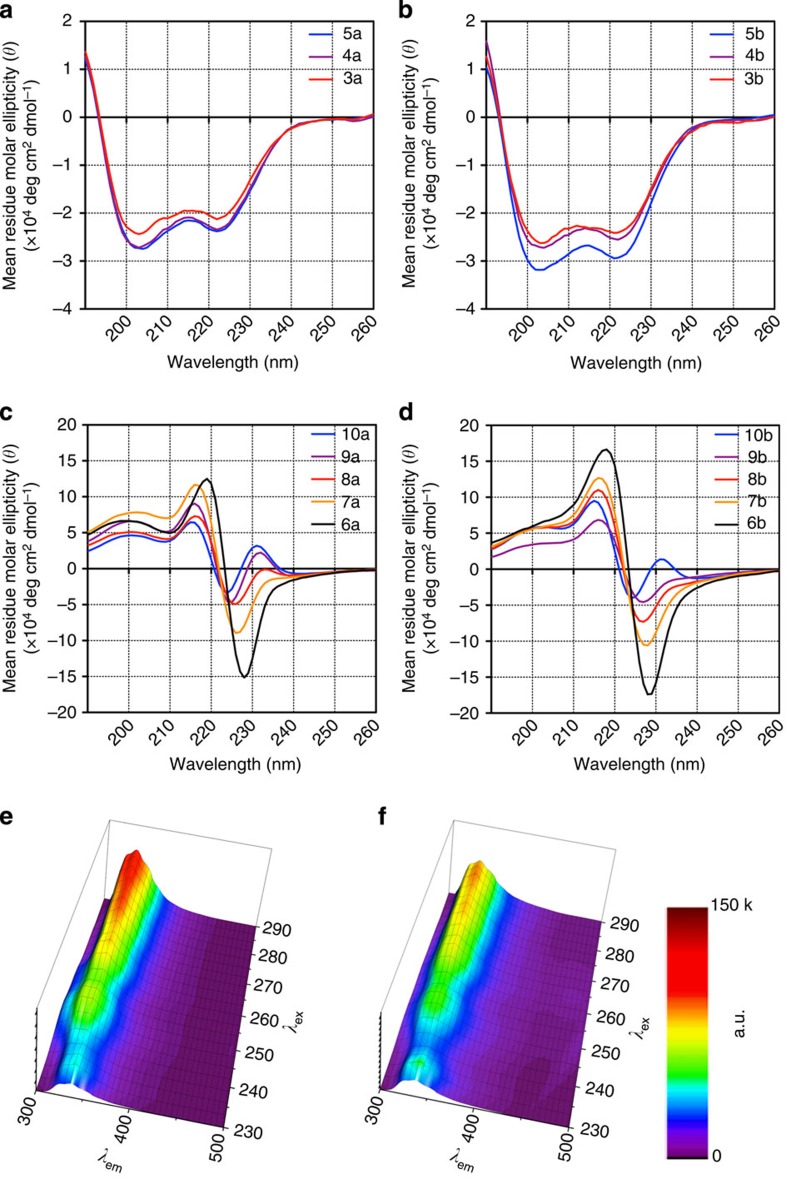
Figure 4. CD and fluorescence spectra.
(a) CD spectra of compounds 3a–5a; (b) CD spectra of compounds 3b–5b; (c) CD spectra of compounds 6a–10a; and (d) CD spectra of compounds 6b–10b measured at room temperature in acetonitrile (60 μM). (e) Fluorescence emission spectra recorded for compound 10a in acetonitrile or (f) in MeOH–acetonitrile (3:2). Spectra were obtained at room temperature using 60-μM solutions, and the intensities are shown in arbitrary units (a.u.).

