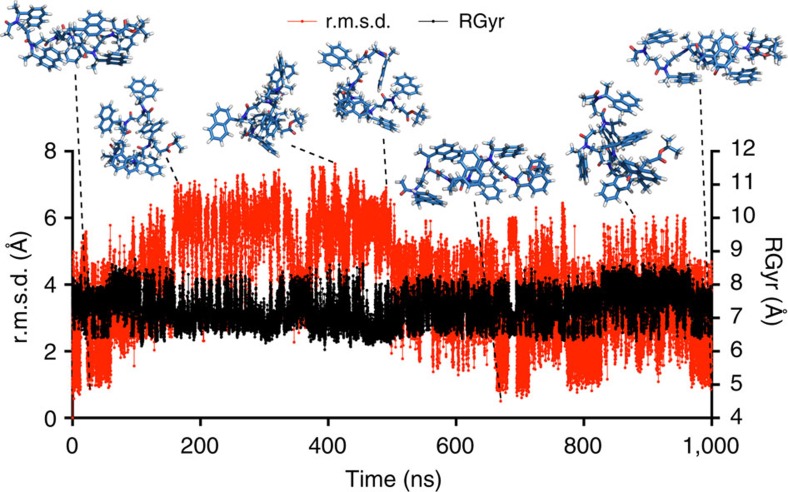
Figure 6. Molecular dynamics simulation of compound 10a in acetonitrile.
The axes show root mean square deviation (r.m.s.d.) and gyrational radius (RGyr) during a 1-μs molecular dynamics (MD) simulation at 300 K. Representative conformations are shown to illustrate the folded and unfolded states of the helical structure throughout the simulation. The simulation is uploaded as Supplementary Movie 1.

