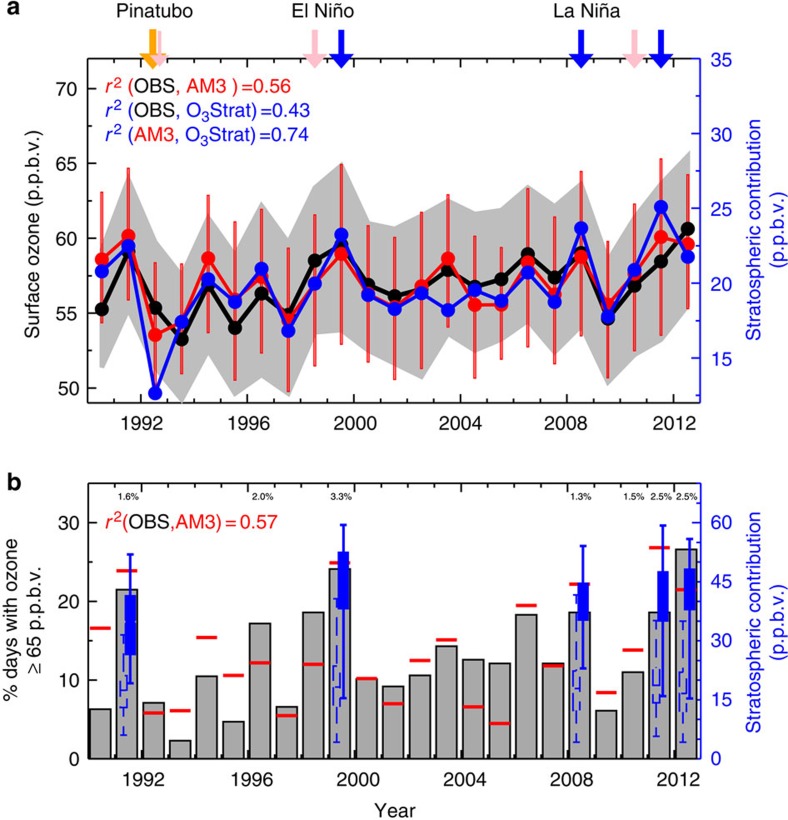
Figure 2. Interannual variability of springtime WUS surface ozone tied to stratospheric influence.
(a) Median of daily MDA8 ozone at 22 high-elevation sites during April–May from 1990 to 2012 as observed (black) and simulated (red) by the GFDL AM3 model with fixed anthropogenic emissions; grey shading and red bars represent the 25th–75th percentiles. The median stratospheric influence for each year (O3Strat, blue) is shown using right axis. (b) Observed (grey) versus model (red) percentage of site-days with MDA8 ozone ≥65 p.p.b.v.; numbers along the top axis are the observed percentage of MDA8 ozone ≥75 p.p.b.v. (≤1% in other years; see Methods section). The blue box-and-whisker plots give the minimum, 25th–75th percentiles and maximum of stratospheric contribution (right axis) on days when total simulated ozone is below 60 p.p.b.v. (dashed) versus above 70 p.p.b.v. (filled) for the high-ozone springs. Arrows at the top of the graph indicate the springs following the Mt. Pinatubo volcanic eruption (orange), strong El Niño (pink) and La Niña (blue) winters (Fig. 6a).

