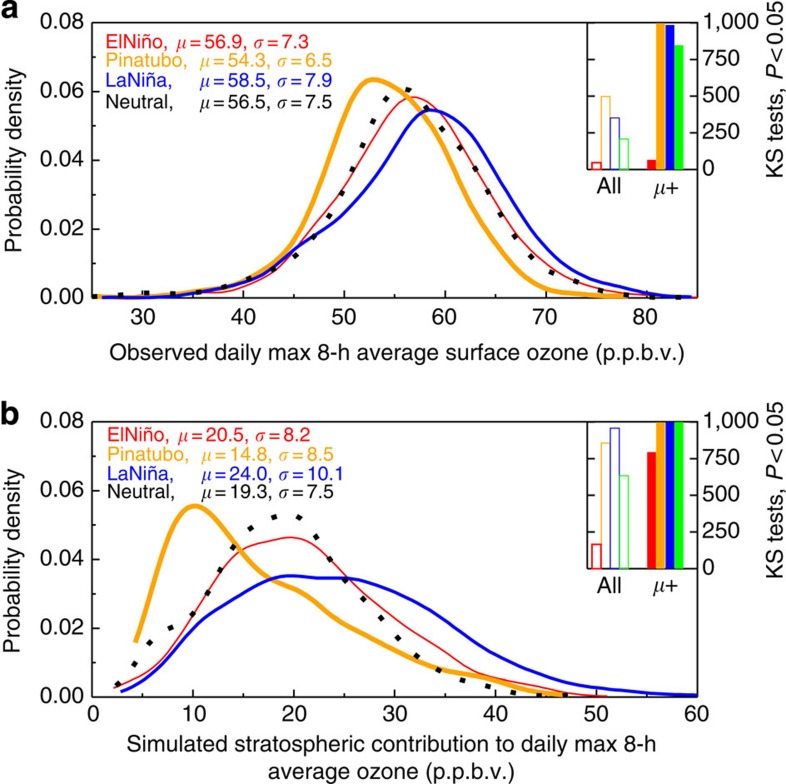
Figure 3. Shifts in the high tail of WUS surface ozone distributions tied to La Niña events and volcanic eruptions.
(a,b) Probability distributions for observed MDA8 ozone (a) and simulated O3Strat (b) sampled in the model surface level during April–May following neutral (2004, 2005; dotted lines), El Niño (1998, 2010; red lines) and La Niña (1999, 2008, 2011; blue lines) conditions, and the Mt. Pinatubo eruption (1992, 1993; orange lines). The median (μ) and standard deviation (σ) are shown (p.p.b.v.). The inset shows the number of KS tests (1,000 total) where the difference in the entire distribution (open bars) and in the values above the median (filled bars), respectively, are statistically significant (at the P=0.05 level) for El Niño versus neutral (red), Mt. Pinatubo versus neutral (orange), La Niña versus neutral (blue) and La Niña versus El Niño (green) years.

