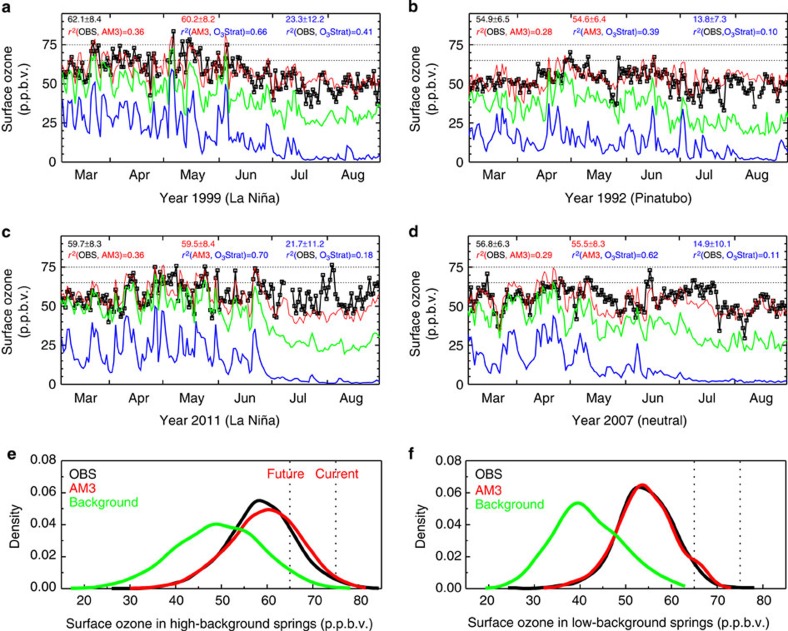
Figure 4. More frequent stratospheric intrusions elevating WUS surface ozone during La Niña springs.
(a–d) Stratospheric and background contributions to surface MDA8 ozone for March through August at Gothic, Colorado in 1999 (a) versus 1992 (b) and at Chiricahua, Arizona in 2011 (c) versus 2007 (d). (e,f) Probability density functions at 22 sites during April–May for La Niña plus the high-ozone springs of 1991 and 2012 (e) and for the low-ozone springs of 1992–1993 (f). Shown are observations (black) and model simulations for total ozone (red), background ozone (green; estimated by shutting off North American anthropogenic emissions, see Methods), and the stratospheric contribution (blue). Dashed lines denote current (75 p.p.b.v.) and proposed (65 p.p.b.v.) US ozone standards. Statistics in (a–d) are for April–June.

