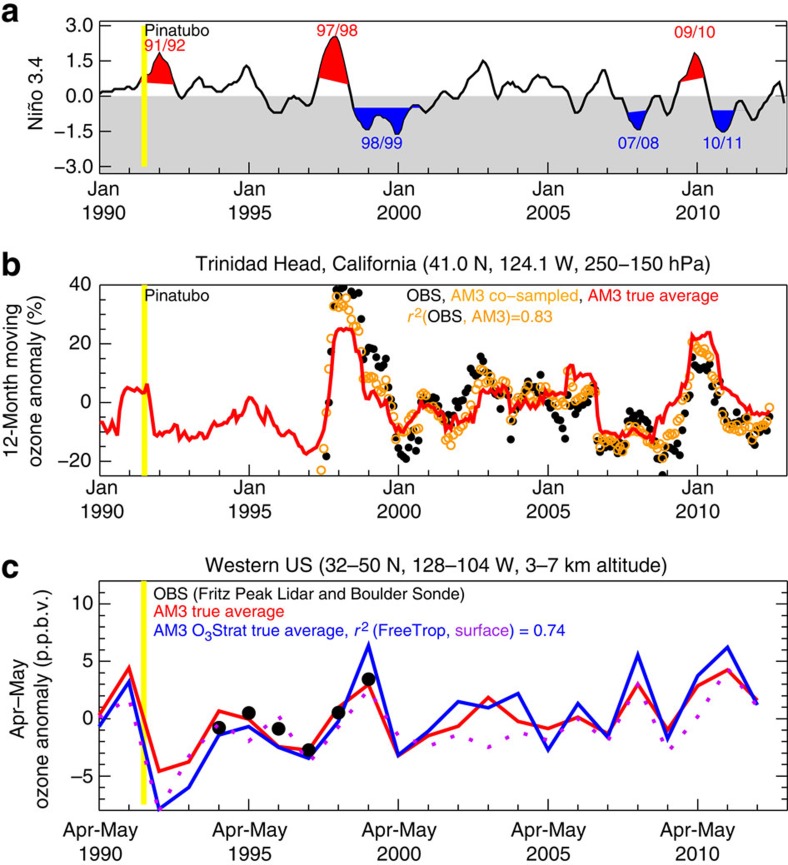
Figure 6. WUS surface ozone variability correlates strongly with ozone in the free troposphere but poorly with that in the UTLS.
(a) The 1990–2012 Niño 3.4 index, highlighting strong El Niño (red) and La Niña (blue) events (see Methods section). (b) 12-Month running mean anomalies (relative to the record mean) of 250–150 hPa ozone at Trinidad Head for 1990–2012: from ozonesondes with weekly sampling (black circles), from the model co-sampled on sonde launch days (orange circles) and from the model ‘true average' of continuous daily sampling (red lines). (c) Mean WUS mid-tropospheric ozone anomaly in April–May: from the combined record of Fritz Peak lidar and Boulder sonde in Colorado (black circles; see Methods section) and from the model true averages of ozone (red) and tracer of stratospheric ozone (blue) over the entire domain (box in Fig. 7a). Also shown are anomalies in mean stratospheric contribution to surface ozone (dashed purple). Continuous ozonesonde profile measurements are not available at WUS sites in the 1980s. The mid-tropospheric ozonesonde records at Trinidad Head and Boulder are not shown in c because the available weekly sonde measurements were too infrequent to capture the actual variability (see Methods section).

