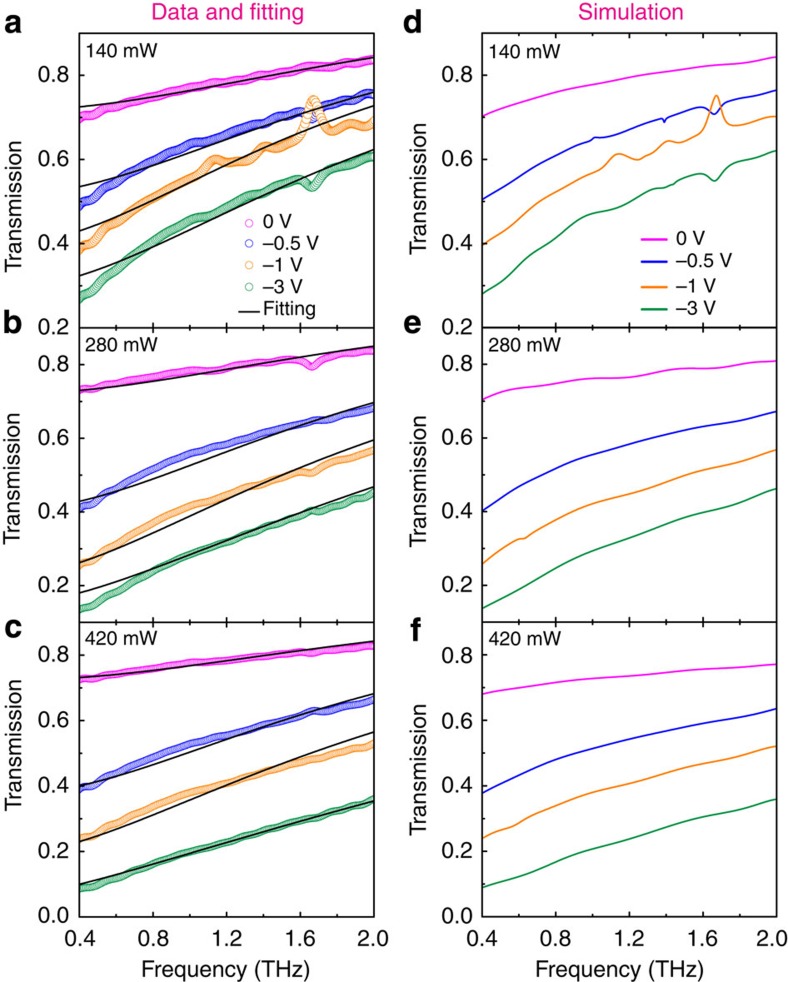
Figure 3. Gate- and photoexcitation-controlled amplitude change of frequency-domain transmission.
(a–c) Measured (circle) and theoretical (solid black curve) values of the transmission amplitude as a function of frequency at gate biases of 0, −0.5, −1 and −3 V under photoexcitation power at P=140, 280 and 420 mW, respectively. (d–f) Plots of simulation results with thin film approximation corresponding to a–c, respectively.

