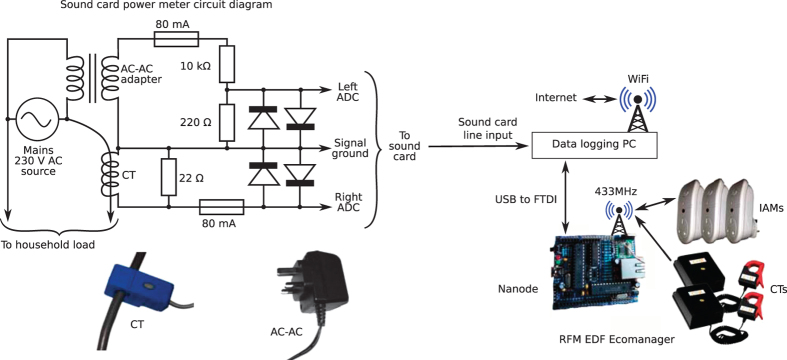
Figure 1. System diagram for the data collection system.

The system has three major components: 1) the data logging PC; 2) the sound card power meter and 3) the ‘RFM EDF Ecomanager’ which uses a Nanode to communicate over the air with a set of individual appliance monitors (IAMs) and current transformer (CT) sensors. On the left is the circuit diagram for interfacing a sound card to a CT clamp and AC-AC adaptor to measure mains current and voltage, respectively. The circuit was adapted from Robert Wall's work31. Each diode is a 1N5282 (1.3 V forward voltage bias).
