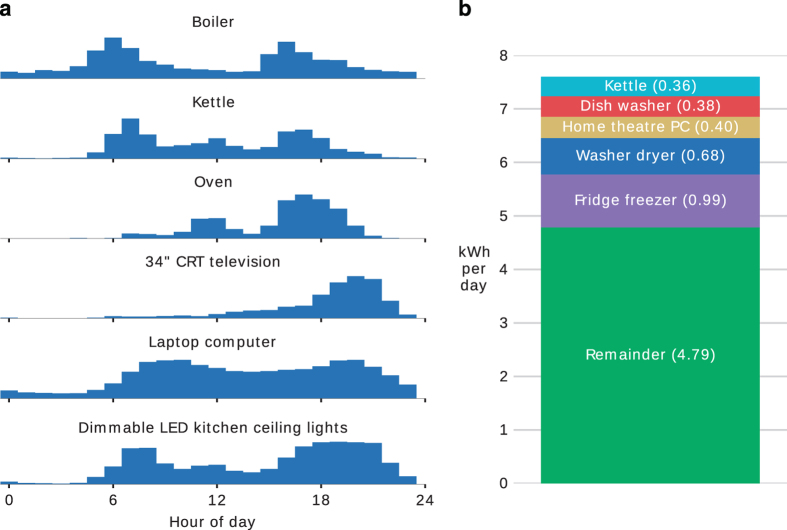
Figure 5. Electrical appliance usage in House 1.
(a) Histograms of daily appliance usage patterns. (b) shows average daily energy consumption of the top-five appliances in House 1. All appliances were ranked by the amount of energy they consumed and the top-five are shown here. All lights were grouped together. The ‘remainder’ block at the bottom represents the difference between the total mains energy consumption and the sum of the energy consumption of the top five appliances. As such, the top edge of the bar shows the average daily total energy consumption for House 1.

