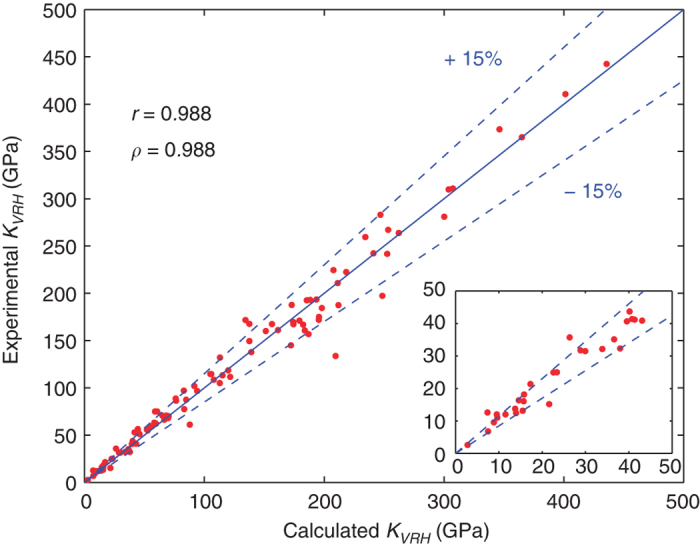
Figure 3. Plot of experimental versus calculated bulk moduli.

Comparison of experimental and calculated bulk moduli for a selected set of systems, with calculated Pearson correlation coefficient r and Spearman correlation coefficient ρ reported.

Comparison of experimental and calculated bulk moduli for a selected set of systems, with calculated Pearson correlation coefficient r and Spearman correlation coefficient ρ reported.