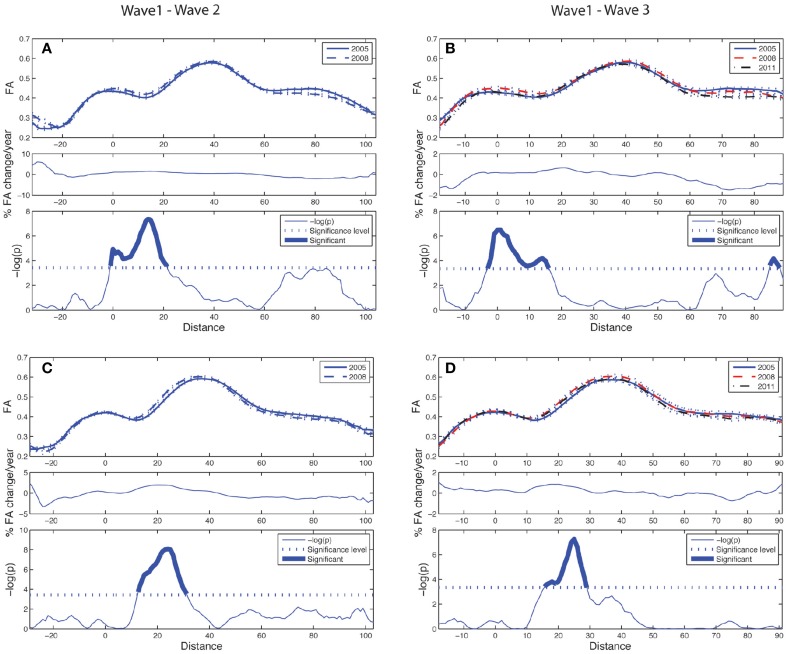
Figure 5.
Tract parameterization of the CST for the two-wave (left column) and the three-wave (right column) analyses. The individual trajectories of the CST, initialized from only one ROI, is normalized into 100 equidistant segments where 0 on the normalized distance axis is located along the CST in the middle part of the precentral WM region, and segment 100 is at a cut at the lower level of the brainstem (cf. image inserts in lower parts of left and right column in Figure 3). (A) Upper panel: Mean FA ± SE (dotted lines) profile of left hemispheric CST at Wave-1 (continuous line) and Wave-2 (broken line). Middle panel: Segment-wise percentage change in mean FA per year in the cohort from Wave-1 to Wave-2. Lower panel: Segment-wise significance in mean FA difference between Wave-1 and Wave-2 in the cohort. (B) Upper panel: Mean FA ± SE (dotted lines) profile of left hemispheric CST in participants having three MRI examinations, Wave-1 (continuous line), and Wave-2 (broken line), Wave-3 (broken & dotted line). Middle panel: Segment-wise percentage change in mean FA per year in the subsample from Wave-1 to Wave-3. Lower panel: Segment-wise significance in FA difference between Wave-1 and Wave-3. (C) Same as in (A) for right hemispheric CST. (D) Same as in (B) for right hemispheric CST. See Figure 4 for further details.

