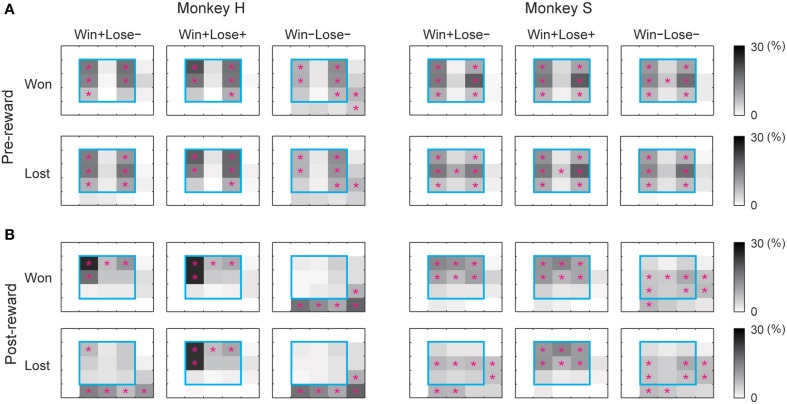
Figure 3.
Percentage of time that the monkey gazed at each section inside and outside the monitor during the analysis periods. (A) pre-reward, (B) post-reward periods. For each analysis period, we calculated the percentage of total time that the monkey looked at each section inside the monitor (divided into 3 × 3 sections) and outside the monitor (resulting in 5 × 5 sections in total). The percentage of total gaze time is shown in grayscale separately for won and lost trials. The cyan square represents the area of the monitor. A magenta asterisk indicates that the gaze duration in that section was significantly longer than that calculated from randomized data (bootstrap method, p < 0.05, 1000 randomizations).

