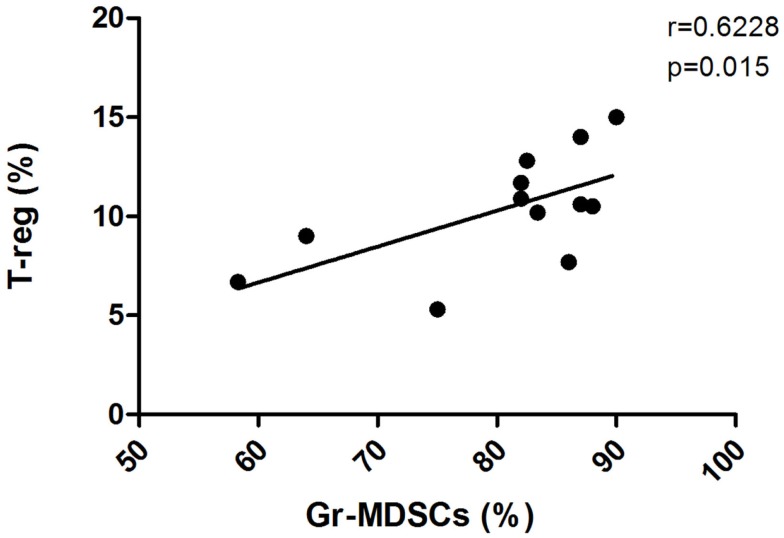
Figure 2.
Frequency of circulating T-reg cells in PB was calculated by cytometric analysis with gates set on CD4+ cells, and the results presented as the percentage of CD25+Foxp3+cells in CD4+ cells. The figure shows the correlation of the percentages of Gr-MDSCs cells and T-reg in PB from CML patients at diagnosis.

