
FIGURE 10.
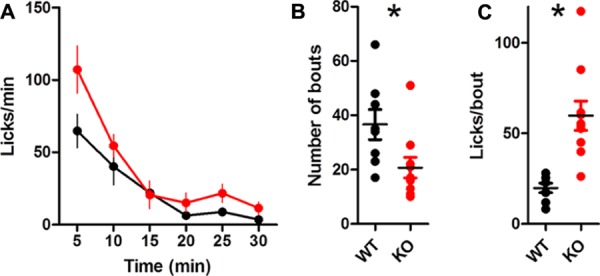
Summary of licking for water. (A) Rate of licking throughout the session. (B) DAT KO mice have fewer bouts of licking. (C) KO mice lick more in each bout, ∗p < 0.05. Points represent data from individual mice. Lines represent mean and SEM.