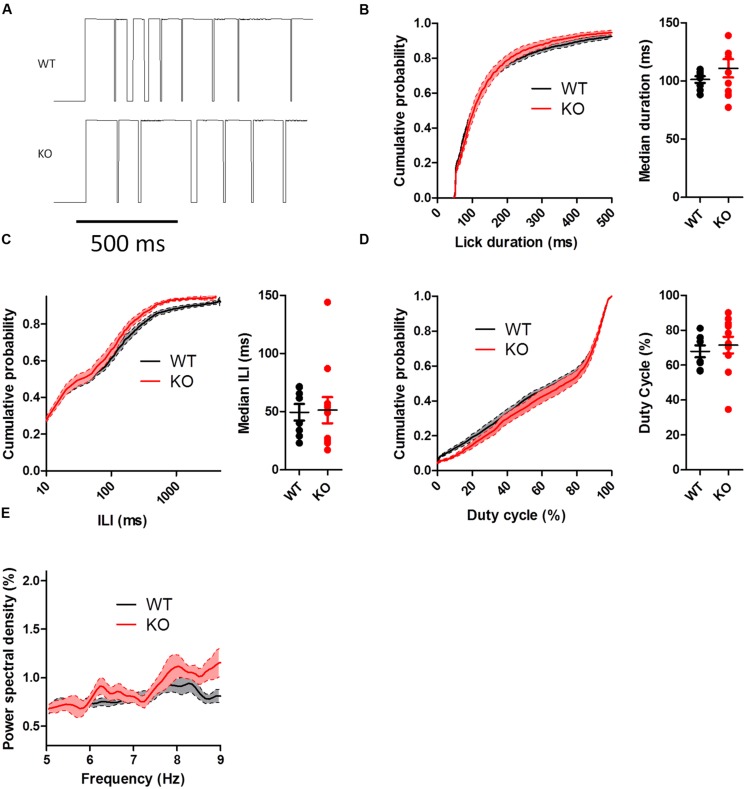
FIGURE 5.
Lick patterning during extinction. (A) Representative lickometer traces for WT (top) and KO (bottom) mice. When the data from the entire extinction session were compared, neither lick duration (B), ILI (C), nor duty cycle (D) were different between WT and KO mice when licking in extinction. (E) Power spectral density of licking. Points represent data from individual mice. Lines represent mean and SEM.

