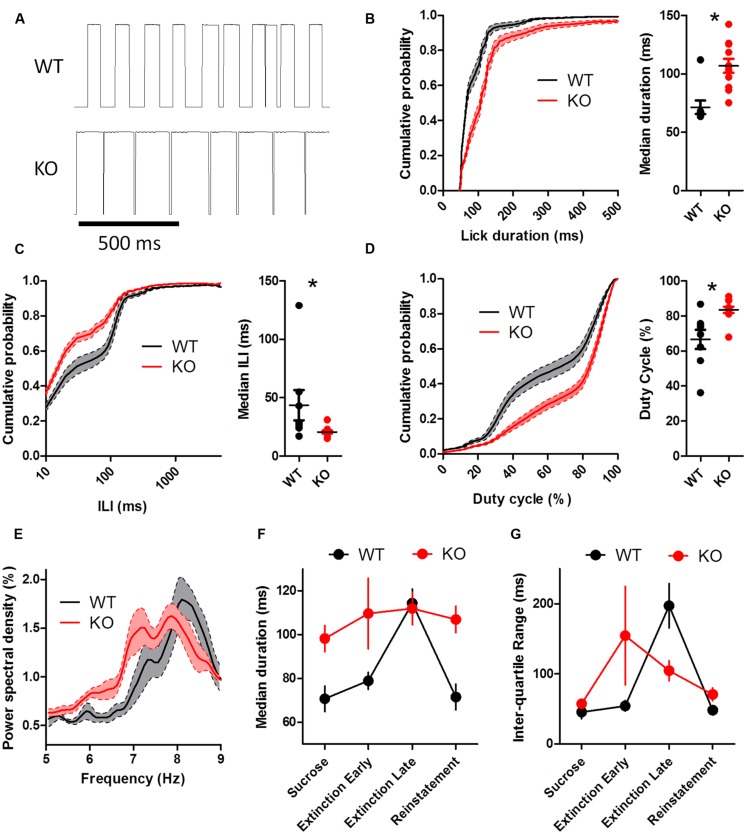
FIGURE 7.
Altered lick patterning in DAT KO mice during reinstatement. (A) Representative lickometer traces for WT (top) and KO (bottom) mice. Lick duration (B), ILI (C), and duty cycle (D) are all different between WT and KO mice when licking for sucrose solution is reinstated. (E) Power spectral density of licking returns to pre-extinction levels. (F,G) KO mice adapt licking behavior to altered feedback during extinction more quickly than WT mice. The first 50 licks during extinction was considered ‘early’ and the last 50 licks was considered ‘late.’ Duration of licks (F) and inter-quartile range of lick durations (G) returns to pre-extinction levels during reinstatement. ∗p < 0.05. Points represent data from individual mice. Lines represent mean and SEM.

