Fig. 1.
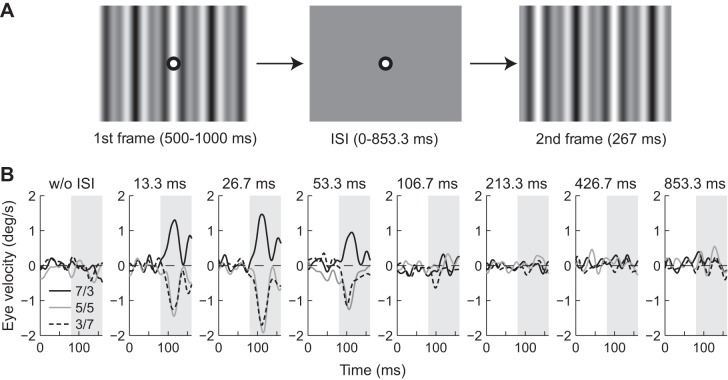
Visual stimuli and ocular responses. A: schematic diagram of visual stimuli. The grating pattern and a central fixation target appeared at the beginning of each trial. After the subject fixated on the central target, the pattern was replaced by a uniform gray image [interstimulus interval (ISI)]. The fixation target then disappeared, and the 2nd frame was presented for 267 ms. The 3f5f stimulus with a contrast ratio of 5/5 is shown. B: R-L eye velocity profiles of ocular responses to 3f5f stimuli with contrast ratios (C3f/C5f) of 7/3 (solid black), 5/5 (solid gray), and 3/7 (broken black) from subject S1. Upward deflections denote eye movements in the direction of stimulus motion. The gray-hatched area indicates the open-loop response interval during which the change in eye position was measured. The corresponding ISI is indicated on the top of each panel.

