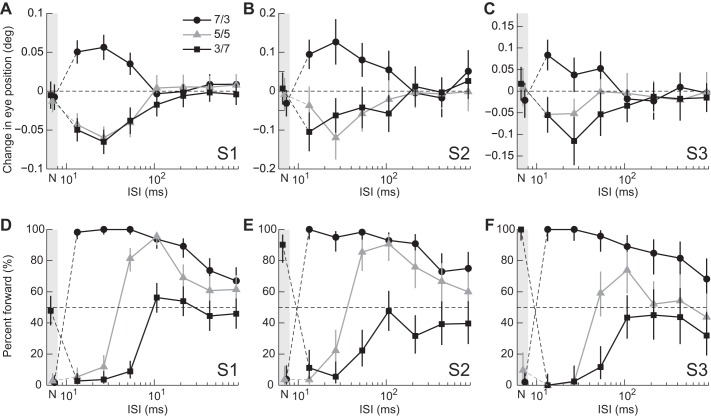
Fig. 2.
Dependence of eye movement and perceptual responses on ISI for individual subjects. Responses to 3f5f stimuli with contrast ratios (C3f/C5f) of 7/3, 5/5, and 3/7 are indicated as black circles, gray triangles, and black squares, respectively. Responses when the ISI was zero (Null) are plotted in the gray-hatched region, the leftmost part of individual panels (labeled “N”). Error bars are 95% confidence intervals. Note the logarithmic abscissa.

