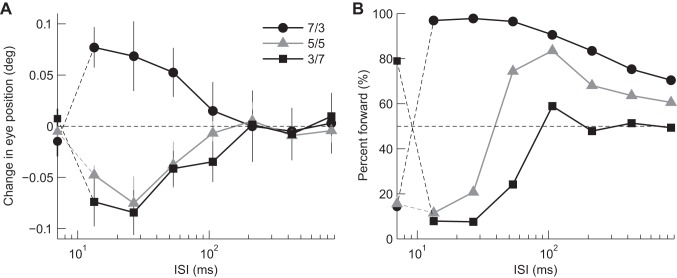
Fig. 3.
Dependence of eye movement and perceptual responses on ISI averaged over individuals (n = 5). Mean eye movement responses with standard deviation and mean perceptual responses are shown in A and B, respectively. Symbols are as in Fig. 2. Responses when the ISI was zero (Null) are plotted on the y-axis.

