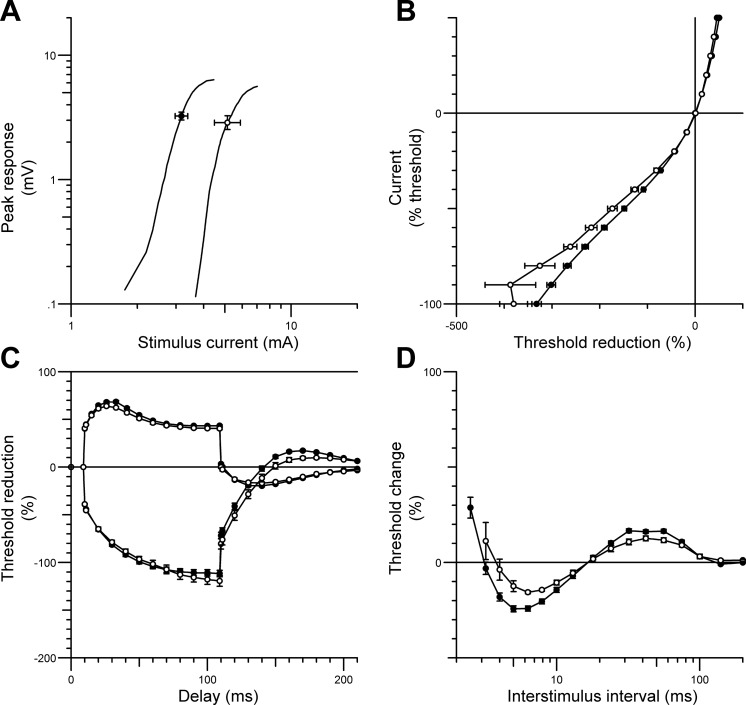
Fig. 2.
Nerve excitability data (mean ± SE) recorded from the abductor pollicis brevis (APB) muscle during median nerve stimulation in SCI patients with neurological level between C3 and T1 (○) compared with responses from normal controls (n = 20; ●). The figure shows the stimulus-response curve (for 1-ms stimulus) (A), the current-threshold relationship (B), threshold electrotonus (C), and the recovery cycle (D). SCI patient data were pooled from both upper limbs.

