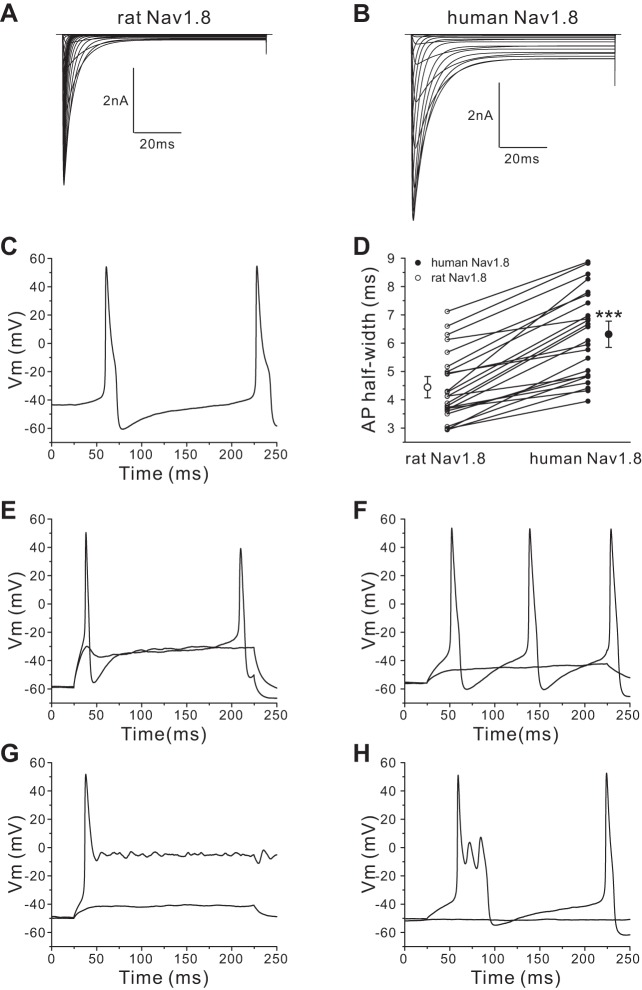
Fig. 6.
Dynamic clamp recording confirms the effect of human Nav1.8 on DRG neuron behavior. A and B: current traces obtained from rat (A) and human (B) Nav1.8 model INa = gmax·m3·h·(Vm − ENa). C: representative spontaneously firing action potential trace after input of human Nav1.8 channel conductance. D: comparison of action potential half-width between human Nav1.8 group and rat Nav1.8 group. ***P < 0.001. Action potential width in each neuron was measured after injection of human Nav1.8 conductance and subsequently in the same cell with injection of rat Nav1.8 conductance (open and filled symbols connected for each neuron). Two larger symbols indicate means ± SE. E and F: type I representative response to rat (E) or human (F) Nav1.8 conductance injection. G: type II representative response displaying extremely long action potential to human Nav1.8 conductance injection. H: type II response displaying early afterdepolarization-like action potential to human Nav1.8 conductance injection.

