
Fig. 7.
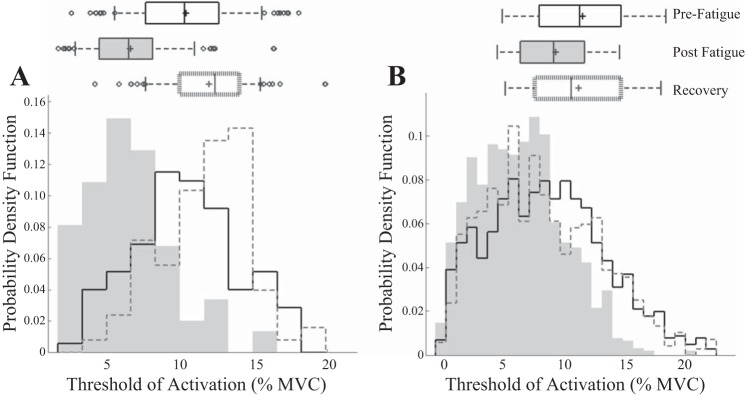
Probability distribution of MU recruitment thresholds for a single subject (A) and across all subjects (B). Boxplots display the mean (line), median (“+”), SD, and outliers of the distribution.
Official websites use .gov
A
.gov website belongs to an official
government organization in the United States.
Secure .gov websites use HTTPS
A lock (
) or https:// means you've safely
connected to the .gov website. Share sensitive
information only on official, secure websites.
Probability distribution of MU recruitment thresholds for a single subject (A) and across all subjects (B). Boxplots display the mean (line), median (“+”), SD, and outliers of the distribution.