
Fig. 8.
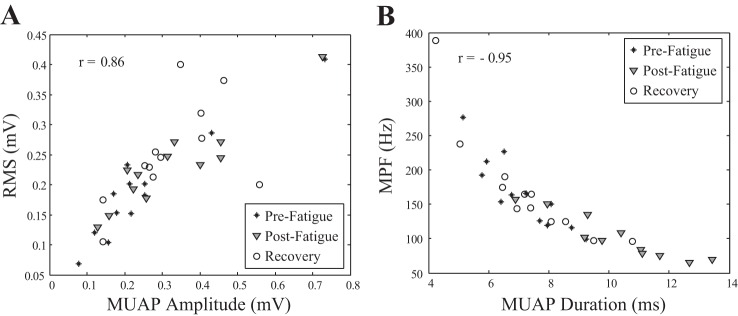
Scatterplot of the median decomposed MUAP amplitude and the RMS amplitude of the global sEMG signal for all subjects for each of the 3 conditions r = 0.86 (A) and the median decomposed MUAP duration and the median frequency of the power spectrum (MPF) of the global sEMG signal for all subjects for each of the 3 conditions r = −0.95 (B).