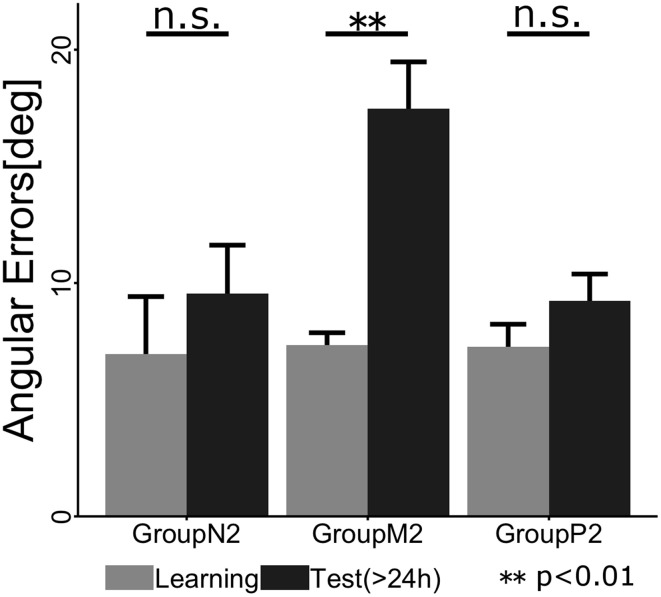
Figure 5.
Mean angular errors of the subjects in each group during the last cycle of the Learning phase (gray) and the first cycle of the Test phase (black). The error bars indicate ± 1 SE. The asterisk denotes a significant difference (p < 0.01) and ”n.s.” indicates no significant difference (p > 0.1).

