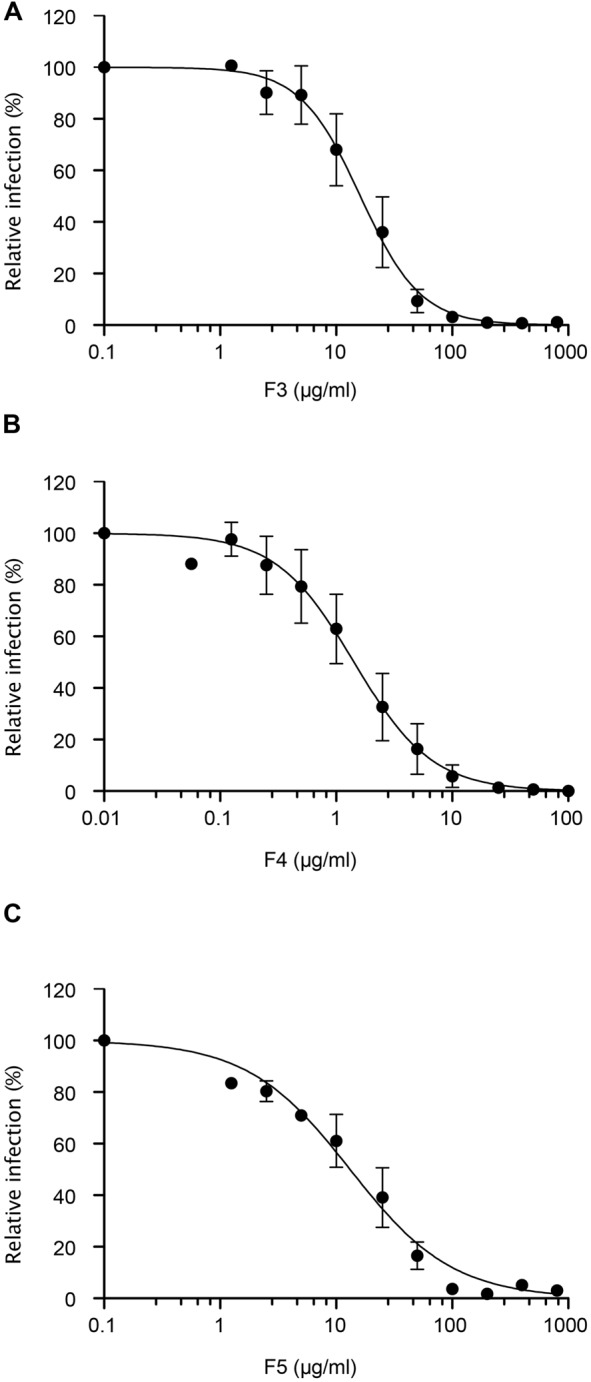
FIGURE 4.

Dose-response study. Huh-7 cells were inoculated with HCVcc in the presence of increasing concentration of plant extracts (A) F3, (B) F4, and (C) F5, for 2 h. Inoculum was removed and cells were further incubated with culture medium. Infectivity was measured by the use of immunofluorescence labeling of HCV E1 envelope protein, and by calculating the number of infected cells (14.7 ± 1.6%, 17.9 ± 1.4%, 15,6 ± 1.1% of infected cells in the DMSO control condition for F3, F4, and F5 extracts dose-response assay, respectively). Data are expressed as a percentage of values obtained in the presence of DMSO. Data are means of values obtained in 3 independent experiments performed in triplicate. Error bars represent SEM.
