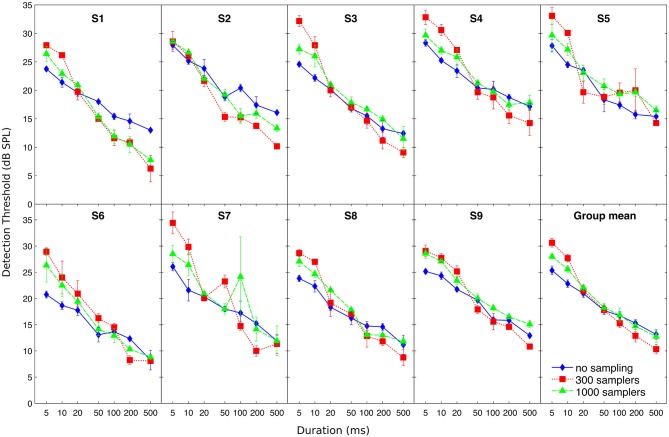
Figure 2.
Individual and mean detection thresholds as a function of stimulus duration. Different symbols illustrate detection thresholds for different undersampling conditions (no sampling, 300 samplers, and 1000 samplers), as indicated by the inset in the bottom-right panel. Error bars show ±1 standard error of the mean calculated over the three threshold estimates (for individual thresholds) or over the final individual threshold estimates (for the group mean).

