
Figure 4.
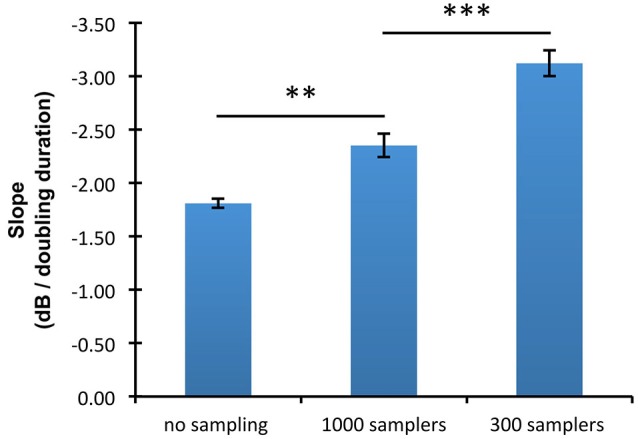
Mean slopes of the threshold/duration functions in the three undersampling conditions (no sampling, 300 samplers, and 1000 samplers). Error bars show ±1 standard error of the mean calculated over the slopes estimated for each participant. Horizontal lines indicate the statistical comparisons made: two asterisks indicate a level of significance of p < 0.01, and three asterisks a level of significance of p < 0.001.