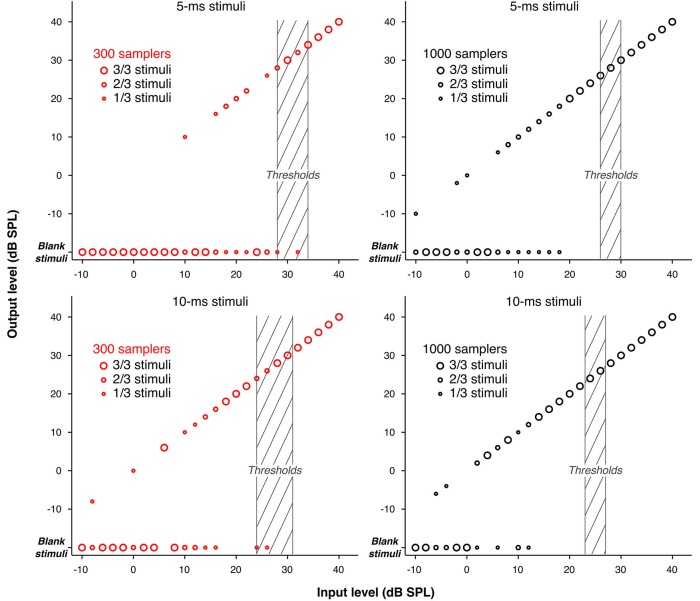
Figure 6.
Input/Output functions showing the actual levels of the pre-generated stimuli (“output level”) as a function of their level before stochastic undersampling (“input level”), for the two shortest durations (5 and 10 ms), processed with 300 and 1000 stochastic samplers. Blank stimuli are also shown. The size of the circles marking the data points varies to indicate the proportions of blank and non-blank stimuli (either 1, 2, or 3 out of the 3 pre-generated stimuli) for each level. Levels above 40 dB SPL are not plotted because none of the stimuli pre-generated for those levels was blank. The shaded areas indicate the ranges of detection thresholds across participants.

