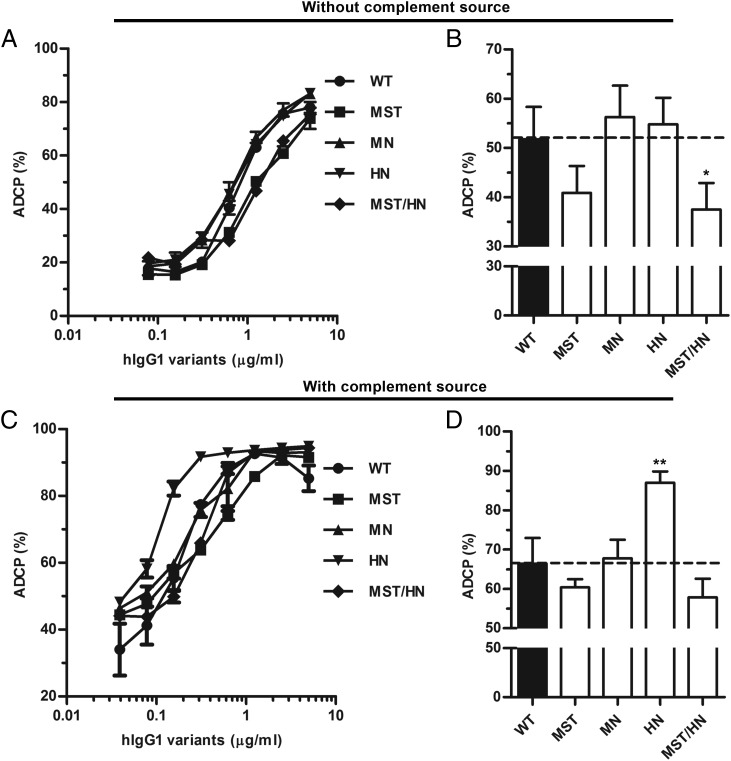
FIGURE 5.
ADCP activity of hIgG1 Fc-engineered variants. (A) ADCP activity measured using PMNs and titrated amounts (5000.0–0.04 ng/ml) of WT hIgG1 and Fc-engineered variants. (B) Histogram showing the average of ADCP activity. (C) ADCP activity measured using PBMCs and titrated amounts (5000.0–0.04 ng/ml) of WT hIgG1 and Fc-engineered variants in the presence of human serum as complement source. (D) Histogram showing the average of ADCP activity in the presence of complement source. Data are shown as mean ± SEM of one experiment performed in triplicate (A and C) and as mean ± SEM of three independent experiments performed in triplicate (B and D). *p < 0.05, **p < 0.01 by one-way ANOVA test.

