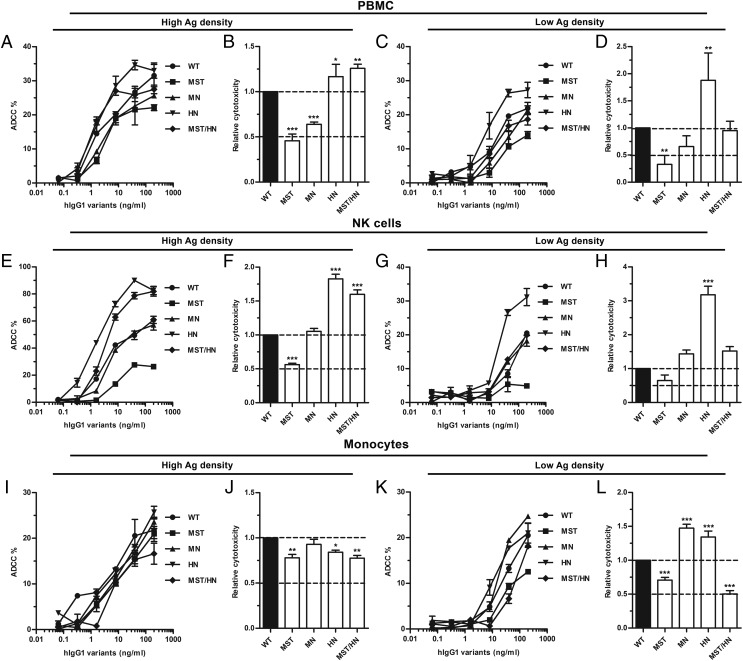
FIGURE 6.
ADCC activity of hIgG1 Fc-engineered variants. (A) ADCC activity measured using PBMCs and titrated amounts (200.0–0.06 ng/ml) of WT hIgG1 and Fc-engineered variants against high-haptenated SRBCs (NIP60Fab). (B) Histogram showing the relative ADCC activity of the hIgG1 variants against high-haptenated SRBCs. (C) ADCC activity measured using PBMCs and titrated amounts (200.0–0.06 ng/ml) of WT hIgG1 and Fc-engineered variants against low-haptenated SRBCs (NIP4Fab). (D) Histogram showing the relative ADCC activity of the hIgG1 variants against low-haptenated SRBCs. (E) ADCC activity measured using pure NK cells and titrated amounts (200.0–0.06 ng/ml) of WT hIgG1 and Fc-engineered variants against high-haptenated SRBCs. (F) Histogram showing the relative ADCC activity of hIgG1 variants against high-haptenated SRBCs. (G) ADCC activity measured using pure NK cells and titrated amounts (200.0–0.06 ng/ml) of WT hIgG1 and Fc-engineered variants against against low-haptenated SRBCs. (H) Histogram showing the relative ADCC activity of hIgG1 variants against low-haptenated SRBCs. (I) ADCC activity measured using pure monocytes and titrated amounts (200.0–0.06 ng/ml) of WT hIgG1 and Fc-engineered variants against high-haptenated SRBCs. (J) Histogram showing the relative ADCC activity of hIgG1 variants against high-haptenated SRBCs. (K) ADCC activity measured using pure monocytes and titrated amounts (200.0–0.06 ng/ml) of WT hIgG1 and Fc-engineered variants against low-haptenated SRBCs. (L) Histogram showing the relative ADCC activity of hIgG1 variants against at low-haptenated SRBCs. Data are presented as mean ± SEM of one experiment performed in triplicate (A, C, E, G, I, and K), and mean ± SEM of three independent experiments performed in triplicate (B, D, F, H, J, and L). *p < 0.05, **p < 0.01, ***p < 0.001 by one-way ANOVA test.

