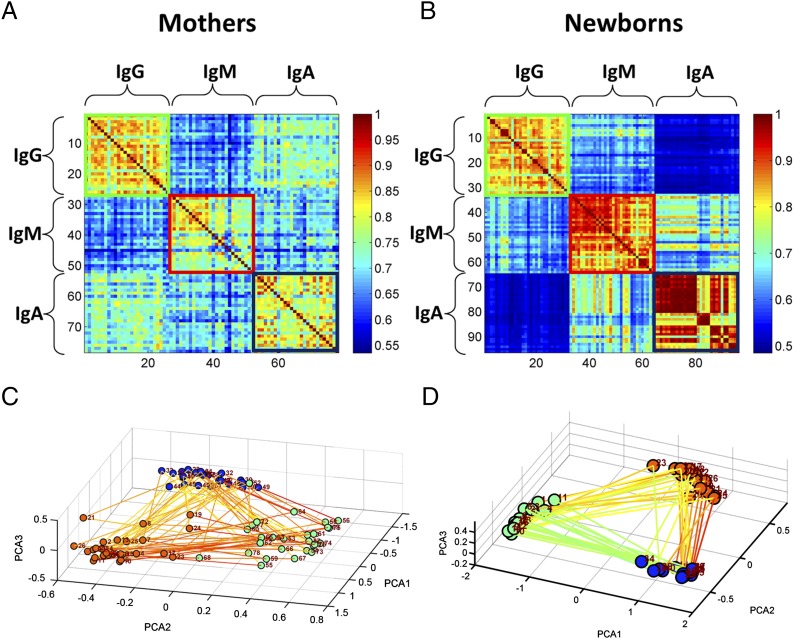
FIGURE 2.
The IgG, IgM, and IgA Pearson's correlation matrix for (A) 26 mothers and (B) 32 newborns. Each subject is represented three times in the figure; the order of the subjects remains the same in each of the isotypes. (C and D) PCA projection of the three isotypes of each sample for the (C) mothers and (D) newborns. The nodes are colored according to the isotype (IgG, green; IgM, red; and IgA, blue). The lines connecting the nodes were drawn between isotypes of the same subject. The lines are colored according to the normalized correlation between the samples.

